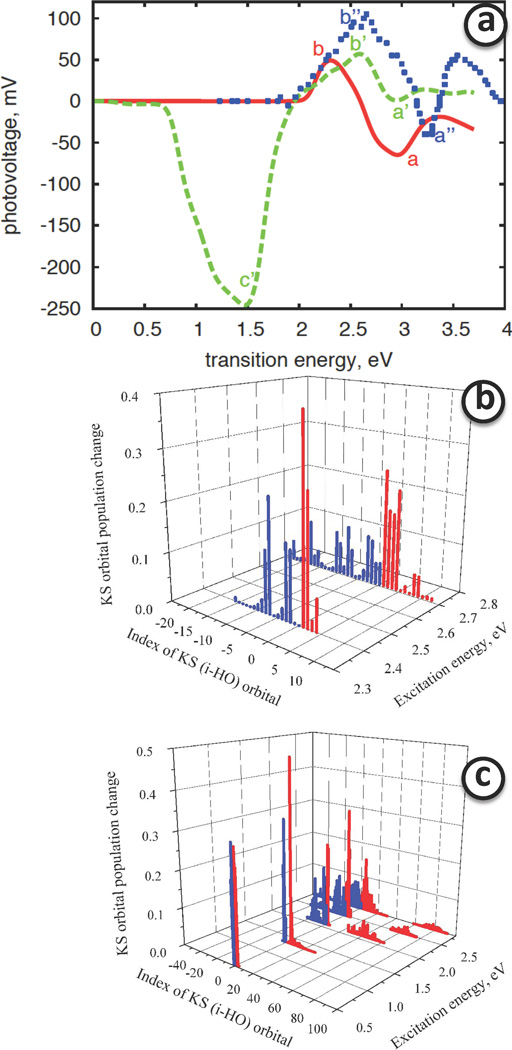
Figure 4.
Panel a Calculated surface photovoltage and corresponding relevant population changes of Kohn-Sham orbitals b–c. Panel a shows calculated Surface photo-voltage as function of photon excitation energy for undoped (solid) and doped surfaces (dashes). Similar features of the spectra are indicated by symbols a, b for undoped and a′, b′ for doped models. The feature c′ for doped model is unique and is appearing due to presence of doping. The blue square symbols correspond to experimental data.107 The features, similar to the calculated ones are labeled as a″ and b″. Panel b Photoinduced change of population of KS orbitals of an undoped titania anatase (100) surface. Orbitals belonging to the CB or VB are drawn as blue and red bars, respectively. Panel c The same for doped titania anatase (100) surface.

