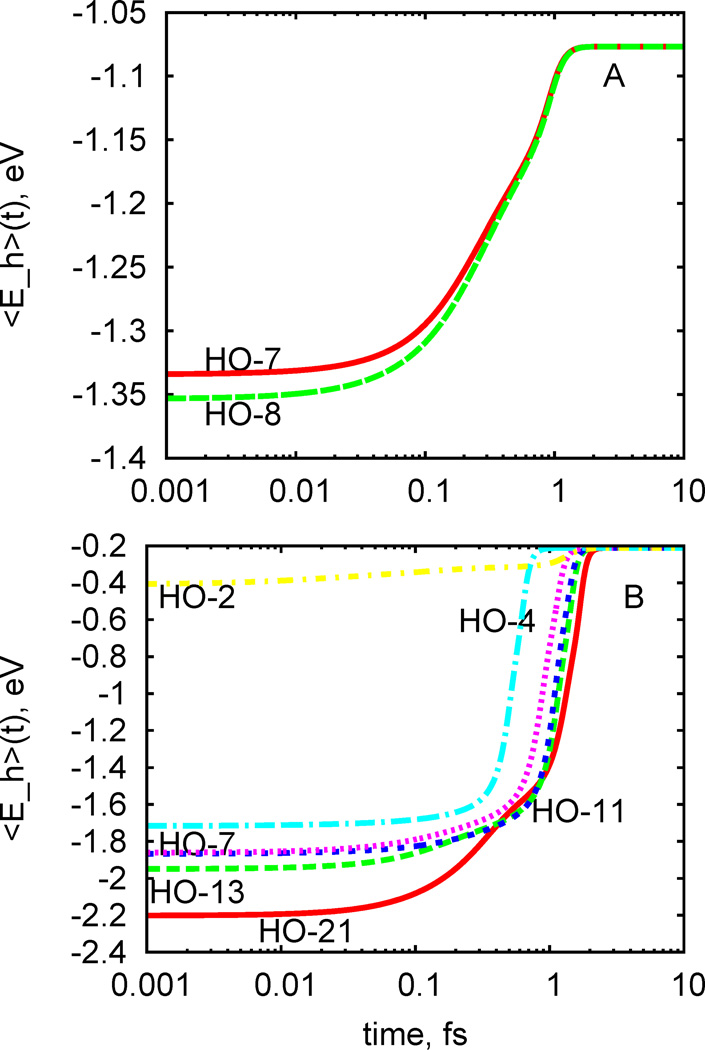
Figure 6.
Dependence of hole relaxation dynamics on the initial excitation. Representative on individual excitations are selected according to electron-hole transitions with maximal oscillator strength. Only the hole dynamics is represented here. The expectation value of the hole energy is calculated by integrating the energy distribution of charge below Fermi energy weighted by relevant energy value. Panel a shows average hole energy dynamics for undoped titania anatase (100) surface, for different initial excitations. Panel b average hole energy dynamics for Ru-doped titania anatase (100) surface, for different initial excitations. The index of VB orbital where initial nonequilibrium population is created is explicitly labeled with the index of the orbital.

