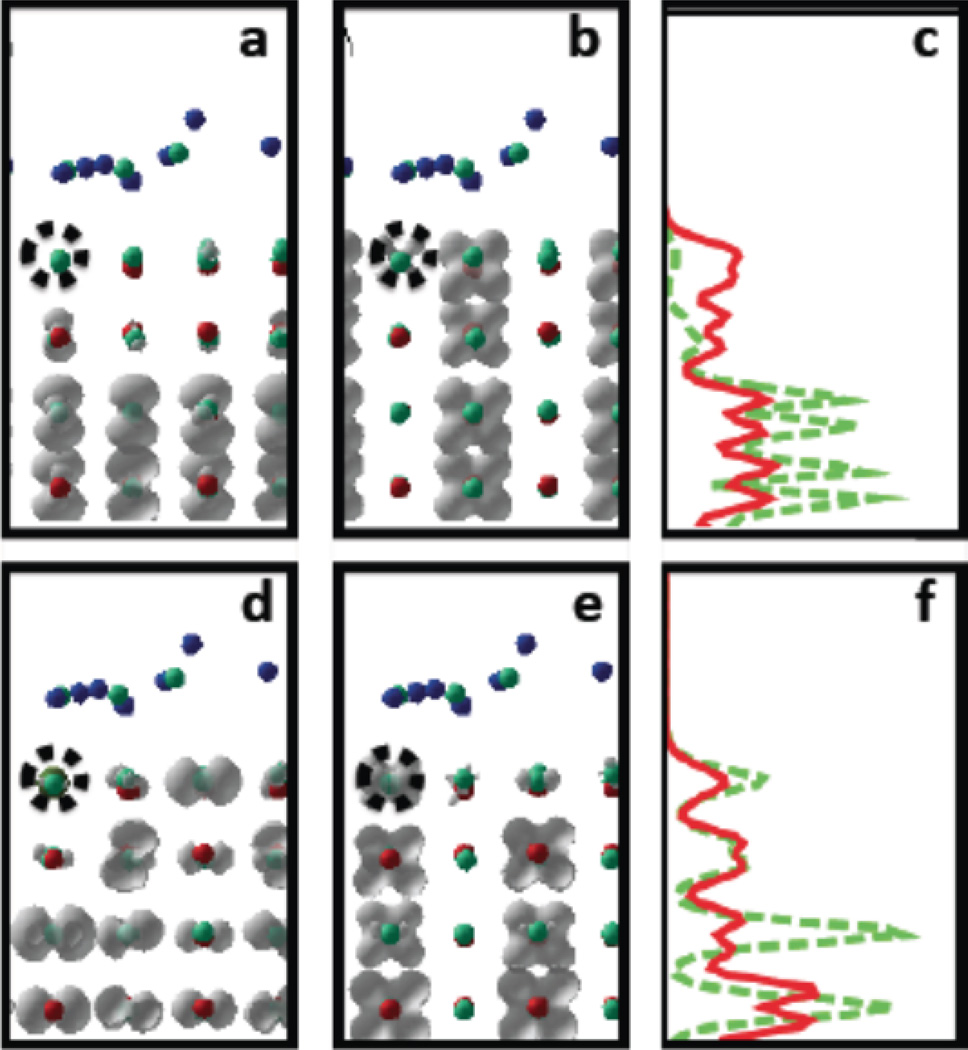
Figure 8.
Bright excitations (2’) and (5’) for doped TiO2 surface. Pairs of occupied and unoccupied KSOs contributing to low-energy optical transitions, for atomic model of anatase TiO2 with (100), exposed, doped by Ru atom and covered by a monolayer of water. Red, green, blue, stand for Ti, O, H atoms. Position of Ru surface doping atom is indicated by dashed circle. Grey clouds symbolize isosurfaces of KSO. Panels a,b,d,e show partial charge density of a given KSO. Panels c, f show partial chagre density integrated over x,y direction, as function of z. < 001 > direction is orthogonal to the plane of figure. This figure show bright transitions which have similar orbital symmetry with those of undoped titania surface. Lowest brightest transition HO′ − 10 to LU′ + 2 at transition energy 2.50 eV with oscillator strength f = 2.16 is represented by panels a–c and labeled as (2’) in Table 2. Panels a and panel c, green dashes stand for HO′ − 10. Panel b and panel c, solid red line stand for LU’+2. Second bright transition similar to one in the undoped structure is HO′ − 11 to LU′ + 4 at transition energy 2.87 eV with oscillator strength f = 1.46 is represented by panels d–f and labeled as (5’) in Table 2. Panel d and panel f, green dashes stand for HO′ − 11. Panel e and panel f, solid red line stand for LU′ + 4.

