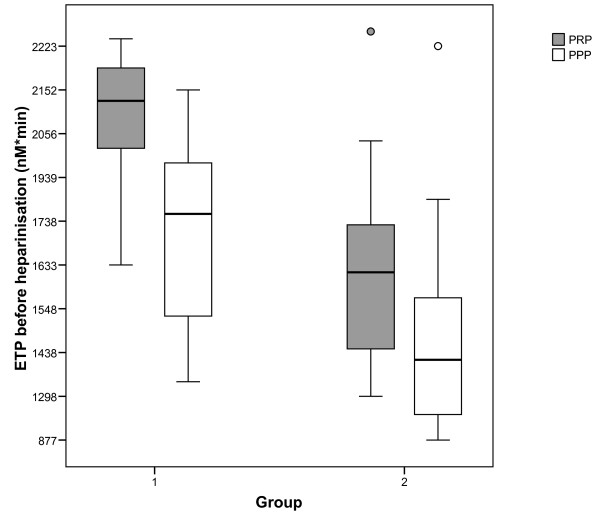
Figure 1.
ETP on T1 in PRP and PPP in both groups. Boxplot showing median, interquartile range and range of ETP measured before heparinisation in patients of group 1 and 2 on x-axis. P-value of comparison of ETP in PRP between the groups is <0.001, p-value of comparison of ETP in PPP between the groups is 0.004; ETP=endogenous thrombin potential; PPP=platelet poor plasma; PRP=platelet rich plasma.

