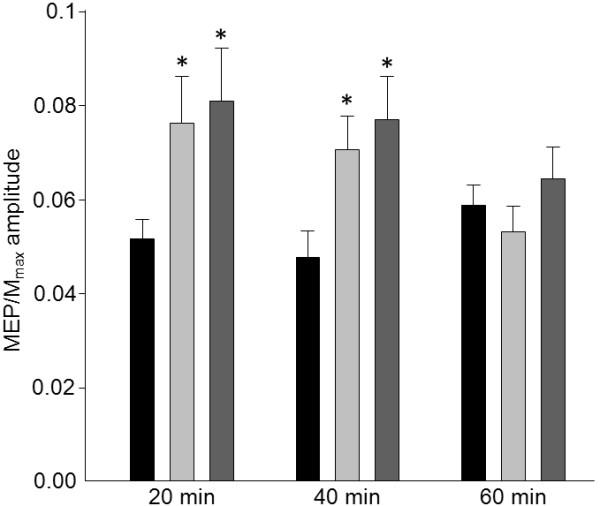
Figure 2.

Group data (mean±SE) of MEP/Mmax amplitude before (black bars), immediately after (post1; light grey bars) and 20-min after (post2; dark grey bars) three motor ES durations (20-, 40- and 60-min). MEP/Mmax amplitudes increased immediately after both the 20- and 40- min applications of motor ES and this increase was maintained 20- min later. There was no change following the 60- min application. * p<0.05.
