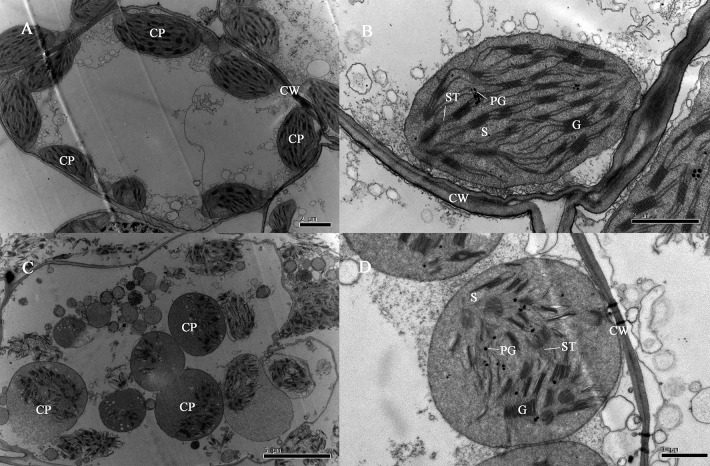
Fig. 2.
Transmission electron microscopic analysis of chloroplasts in the ygld mutant and the wild type. A and B: Chloroplasts in the wild type (wt) plants with normal green leaves. C and D: Chloroplasts in the ygld mutant with yellow-green leaves. CP, chloroplast; PG, plastoglobule; G, grana; S, stroma; CW, cell wall; ST, stroma thylakoid. Scale bars on the lower right corner are 2 μm, 1 μm, 5 μm and 1 μm.

