
Fig. 3.
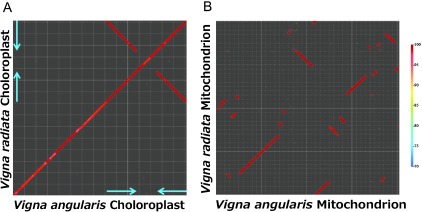
Dot-plot analysis of organelle genomes between azuki bean and mungbean. (A) cpDNA. Gridlines are drawn every 10 kb. Blue arrows indicate IRs. (B) mtDNA. Gridlines are drawn every 10 kb. The color bar indicates sequence identity.
Official websites use .gov
A
.gov website belongs to an official
government organization in the United States.
Secure .gov websites use HTTPS
A lock (
) or https:// means you've safely
connected to the .gov website. Share sensitive
information only on official, secure websites.
Dot-plot analysis of organelle genomes between azuki bean and mungbean. (A) cpDNA. Gridlines are drawn every 10 kb. Blue arrows indicate IRs. (B) mtDNA. Gridlines are drawn every 10 kb. The color bar indicates sequence identity.