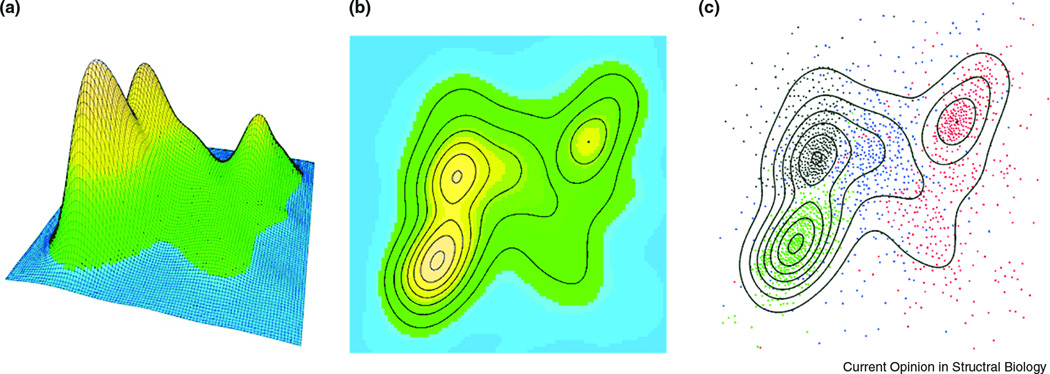
Figure 3. Distribution of protein structures in a space based on geometric similarities.

2000 SCOP domains [56] are selected (428 all α, 546 all β, 561 α+β, and 465 α/β) and clustered by CLANS [71] according to structure similarity measured by DALI Z-scores [54]. The probability density is estimated with the kernel method by MASS R statistical package and shown as (A) 3D perspective and (B) contour plot, color-coded from blue to orange. In panel (C), the actual points for SCOP domains are overlaid on the plot, with all α, all β, α+β, and α/β classes marked black, red, blue and green, respectively. Density peaks correspond to α/β, all α, and all β classes, with domains of α+β class scattered more diffusely.
