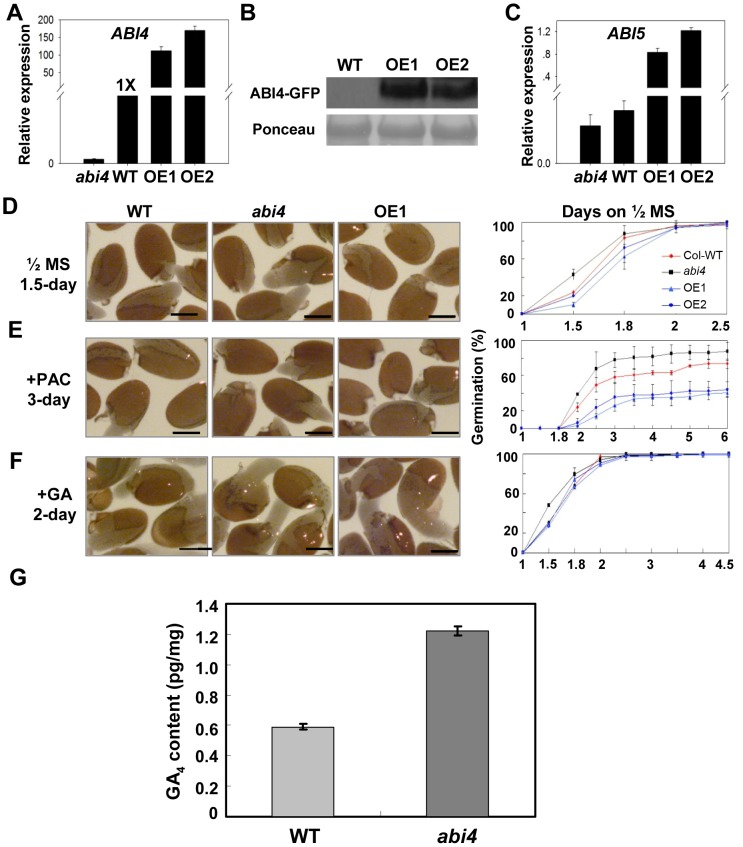
Figure 3. GA biogenesis is impaired in seeds of abi4 mutant.
(A) Two independent homozygous OE-ABI4 lines were identified through qRT-PCR. (B) Western blot confirmed the two OE-ABI4 transgenic lines. (C) ABI5 expression analysis in abi4, WT and two OE-ABI4 transgenic lines. (D)–(F) Germination analysis of WT, abi4, OE-1 and OE-2 seeds on 1/2 MS medium (D) 1/2 MS medium supplemented with 15 µM PAC. (E) 1/2 MS medium supplemented with 0.5 µM GA (F). Quantitative analysis of germination rates are shown in the right panels (n≥45). One representative image (time points indicated in figures) per genotype is shown (left panels). Bar = 0.25 mm. Percentages are average of three repeats ± standard error. (G) Endogenous GA4 levels in abi4 and WT seeds were determined. Two-week stored seeds were used for analysis. Percentages are average of three repeats ± standard error.

