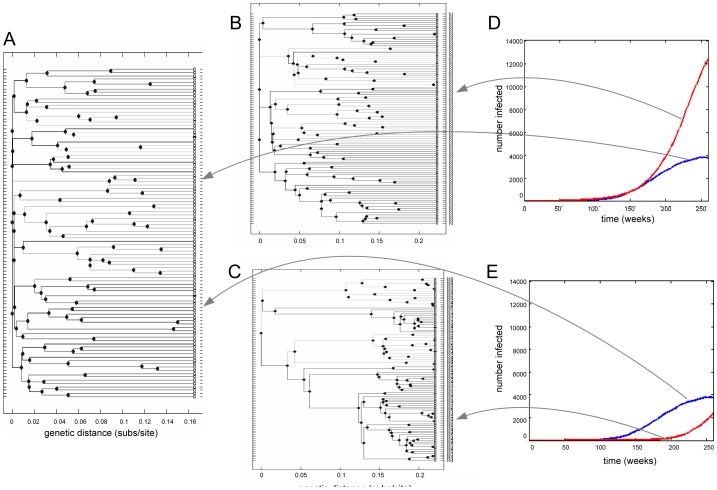
Figure 2. Trees constructed from pathogens spreading on the NATSAL and ER networks supporting very different epidemic trajectories.
A: Phylogenetic tree from the NATSAL network, corresponding to the pathogen prevalence in panels D and E (blue lines). B and C: tree derived from the pathogen spreading on an ER network, corresponding to the red lines in D and E respectively. The ER prevalence was varied by changing the transmission parameter. Sampling was done at time 260 weeks.

