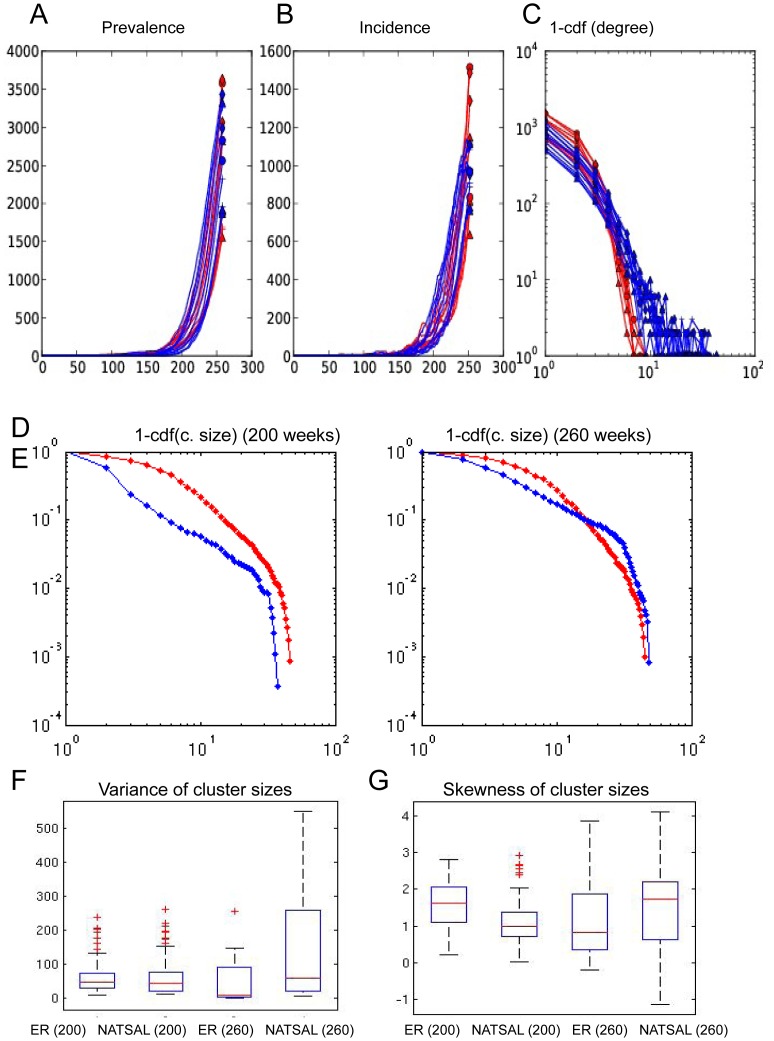
Figure 5. Network prevalence, incidence and 1-cumulative degree distributions for ER (red) and NATSAL (blue) dynamic networks with  .
.
Note that the NATSAL network admits similar epidemic trajectories with markedly different degree distributions (A–C). Panels D, E show the cumulative distributions of the cluster sizes in the ER (red) and NATSAL (blue) networks, and illustrate that these do not parallel the degree distribution; NATSAL networks do not have particularly more variable cluster sizes within trees. Panels F and G show the variance and skewness in boxplots; each box represents all trees from the given network and time point as in other figures.

