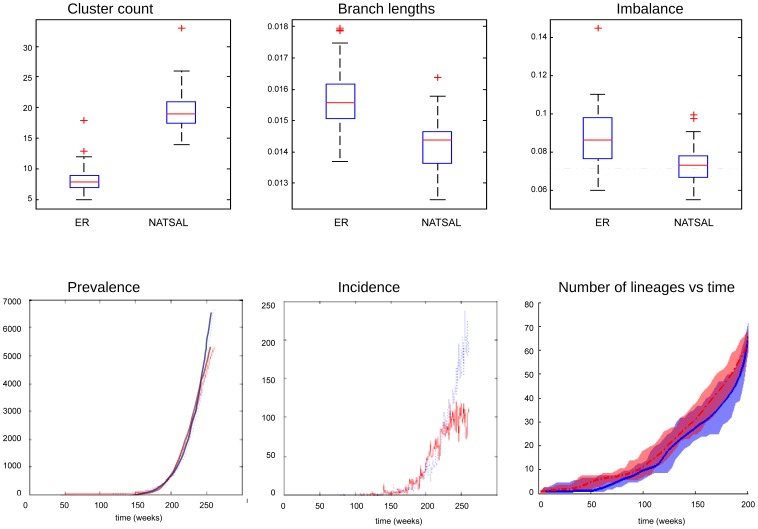
Figure 9. Cluster count, branch length and imbalance (top row) for a pathogen with duration of infectiousness d = 40, taken from simulations in which incidence and prevalence were as closely matched as possible.
Dashed line indicates the expected imbalance for trees of this size [51]. Prevalence and incidence over time in an ER network (blue) and NATSAL-based network (red) are shown in the bottom row for dynamic ER and NATSAL underlying contact networks. The number of lineages through time (LTT) in the trees for ER (solid) and NATSAL (dotted) is also shown. The LTT plots show the LTT for all trees; mean LTT at each time are indicated with dotted and solid lines and the coloured regions range from the minimum to the maximum. Distributions were close to uniform over this range. The ranges almost entirely overlap.

