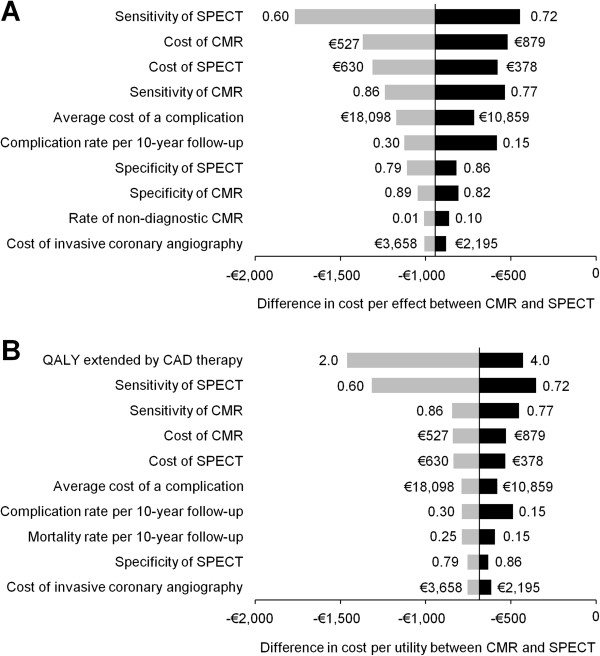
Figure 3.
Sensitivity analyses. Tornado diagrams displaying the results of deterministic one-way sensitivity analyses of cost per effect (A) and cost per utility unit (B) determined at a prevalence of coronary artery disease (CAD) of 0.50. Each bar represents a sensitivity variable. The vertical axis intersects the horizontal axis at the base-case cost per effect (−€945/accurate diagnosis of CAD) or cost per utility unit (−€685/increase in quality-adjusted life-years; ΔQALY) difference between cardiovascular magnetic resonance (CMR) and single-photon emission computed tomography (SPECT). The width of each horizontal bar illustrates the impact of the respective parameter on base-case results. The values adjacent to either side of a bar represent the highest or lowest value simulated for each model input parameter. Complication or mortality rates per 10-year follow-up apply to patients with false-negative test results. For input variables, see Table 1.

