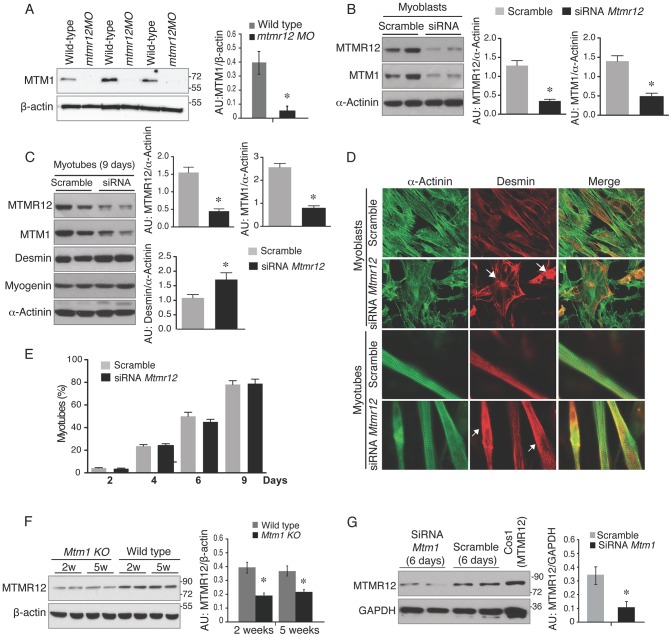
Figure 6. Loss of protein stability in the absence of myotubularin-MTMR12 interactions.
(A) Knockdown of mtmr12 resulted in a strong decrease of myotubularin protein in mtmr12 morphant zebrafish at 3 dpf by western blotting. Western blot analysis was done on three independently injected clutches (n in each clutch = 50–75). The histogram at right shows normalized amounts of myotubularin in control and mtmr12 morphant zerbrafish, *P≤0.01. (B) siRNA-mediated knockdown of Mtmr12 in C2C12 myoblasts leads to decreased protein levels of MTM1. Histograms showed western blot quantification of MTM1 and MTMR12 with reference to α-actinin as a loading control. Data represent mean of 3 independent experiments, * P<0.05. (C) Mtmr12 siRNA treated myoblasts were differentiated into myotubes and tested for protein expression of MTM1, MTMR12, desmin and myogenin. Mtmr12 knockdown in myotubes leads to decreased protein levels of MTM1 and increased amounts of the intermediate filament protein desmin, but do not affect myogenin levels. α-Actinin was used as the loading control (histograms). Data represent mean of 3 independent experiments, * P<0.05. (D) Labeling of α-actinin and desmin in C2C12 myoblast and myotubes treated with Mtmr12 siRNA or scramble control siRNA. Mtmr12 knockdown cells showed abnormal accumulation of desmin in both stages (arrow). (E) Quantification of myotubes at 2, 4, 6 and 9 days of differentiation showed no significant differences between siRNA-Mtmr12 cells and scramble siRNA. Data were obtained from 2 independent experiments (* P<0.05) and minimum of 100 cells per condition were counted. (F) Mtm1 knockout mice exhibited highly reduced levels of MTMR12 protein in skeletal muscle at pre-symptomatic (2 weeks) as well as symptomatic stages (5 weeks). The histogram on right shows normalized amounts of MTMR12 in control and Mtm1KO Mice, *P≤0.05. (G) siRNA-based Mtm1 knockdown in C2C12 cells led to no reduction in MTMR12 protein as seen by western blot analysis. β-actin/GAPDH were used as loading controls in western blots. The histogram at right shows normalized amounts of MTMR12 in control and Mtm1 knockdown cell line, *P≤0.05.

