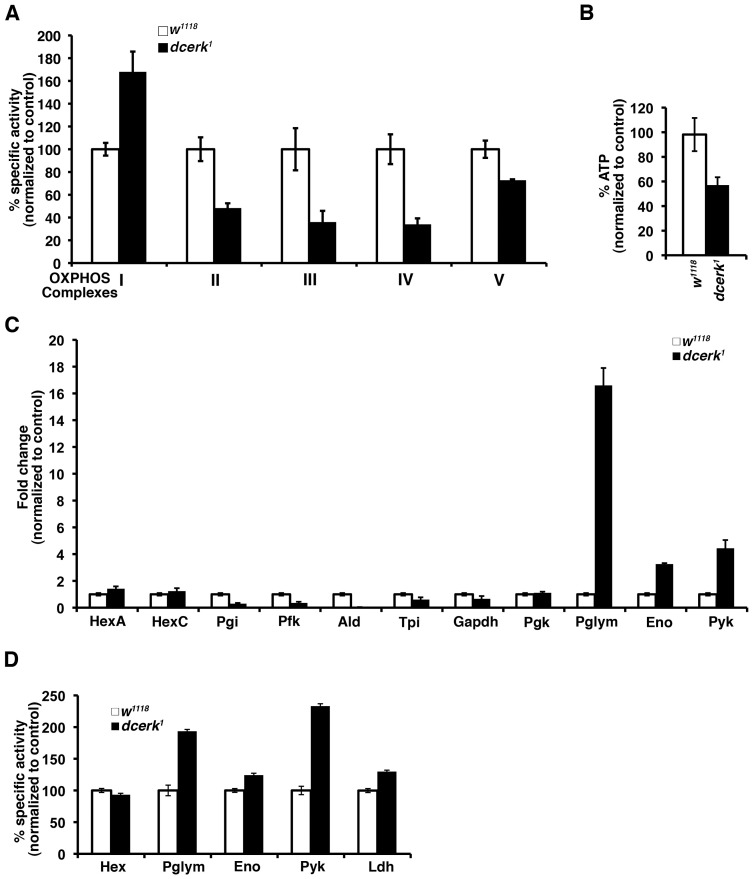
Figure 2. dcerk1 mutants show decreased mitochondrial oxidative phosphorylation, lower ATP level, and increased glycolysis compared to control flies.
(A). The activity of each of the electron transport chain complexes is measured spectrophotometrically using specific substrates and inhibitors in mitochondria isolated from control and mutant flies. Specific activity per mg of mitochondrial protein was calculated and then normalized to w1118. Mitochondria were prepared from 1000 flies and 3 replicates were carried out. Error bars represent standard deviation. (B). ATP level is measured in w1118 and mutant fly mitochondria by a bioluminescence assay using luciferase catalyzed oxidation of luceferin which is ATP dependent. The amount of ATP is calculated per mg of mitochondrial protein and normalized to w1118. The relative level of ATP in the mutant mitochondria is 60% of w1118. n = 3, error bars represent standard deviation. (C). QPCR analysis of transcripts encoding glycolytic enzymes show a 16–18 fold increase in Pglym, 3–4 fold increase in Eno and 4–5 fold increase in Pyk levels in dcerk1 relative to w1118. n = 3, error bars represent standard deviation. (D). Measurement of specific activities of glycolytic enzymes show increase in Pglym, Eno, Pyk and Ldh activities of dcerk1 compared to w1118 while that of hexokinase is not significantly different. Specific activity of each enzyme is determined per mg of protein and then normalized to w1118. n = 3, error bars represent standard deviation.

