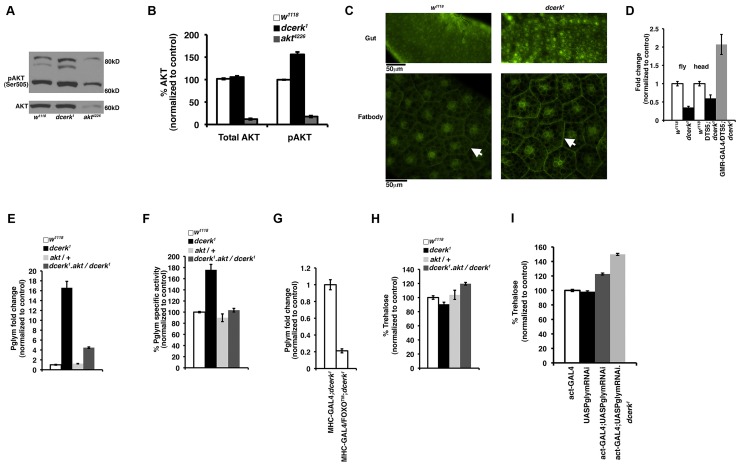
Figure 3. Increased glycolytic flux in dcerk1 compared to w1118 due to activation of Pglym and downstream glycolytic enzymes through AKT.
(A). Total AKT and phospho AKT are monitored in control and mutant flies by Western blots. One band is observed for total AKT and it is not significantly different between w1118 and mutant. Two major bands and one minor band are observed for phospho AKT and these are increased in dcerk1 compared to w1118. The blots also show that total AKT and phospho AKT are both reduced significantly in the hypomorphic allele akt4226 used in this study. (B). Quantification of total AKT and phospho AKT levels. Densitometric scanning of total AKT and phospho AKT bands from Western blots was carried out. The phospho AKT graph represents the average obtained after combining the values from all three bands observed on blots. The values were normalized to w1118 taken as 100%. (C). tGPH staining is monitored in control (upper left panel) and dcerk1 (upper right panel) adult midgut. The lower left panel shows tGPH staining in control while the lower right panel shows that in mutant larval fat body. There is increased tGPH staining at the cell membranes (compare arrows) indicating increased PIP3 levels and therefore increased PI3K activity. In addition to plasma membrane, nuclear tGPH is also increased in dcerk1 gut since it has been reported that nuclear tGPH is also visible in many cell types when PIP3 levels are increased in cells. Midguts from 15–20 flies were visualized in each experiment and three independent experiments were carried out. For visualizing tGPH in fat body, 15–20 early third instar larvae were used in each experiment and three independent experiments were carried out. Scale bar represents 50 µm. (D). FOXO transcript level is measured by QPCR and shows a 60% reduction in in dcerk1 flies compared to w1118. FOXO transcript level increases in the mutant heads when proteosomal degradation is inhibited by overexpressing DTS5 subunit in dcerk1 photoreceptors compared to w1118 or DTS5 without driver in dcerk1 head samples. (E, F). Transcript level (E) and enzyme activity (F) of Pglym are significantly decreased when AKT activity is genetically reduced in dcerk1 suggesting AKT mediates Pglym activation in dcerk1. (G). Overexpression of constitutively active FOXO in the muscles (MHC-GAL4) significantly decreases whole body Pglym transcript level. n = 3, error bars represent standard deviation. (H). Reduction of AKT in dcerk1 increases total body trehalose level. Trehalose level is calculated per mg of protein and normalized to w1118 level. n = 3, error bars represent standard deviation. (I). While actin GAL4 driver or UASPglymRNAi transgene individually have no effect on trehalose level, combining them increases whole animal trehalose by 20% in w1118 and 50% in dcerk1. n = 3, error bars represent standard deviation.

