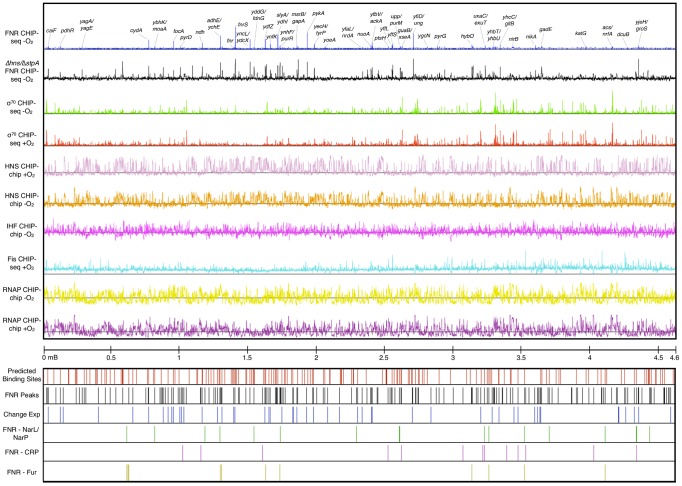
Figure 1. ChIP-seq and ChIP-chip data used in this study.
The tracks are (from top): FNR ChIP-seq −O2 (blue) with peaks upstream of a subset of genes labeled, FNR ChIP-chip in Δhns/ΔstpA −O2 (black), σ70 subunit of RNAP ChIP-seq −O2 (green), σ70 subunit of RNAP ChIP-seq +O2 (red), H-NS CHIP-chip +O2 (light purple), H-NS ChIP-chip −O2 (orange), IHF ChIP-chip −O2 (purple), Fis ChIP-seq +O2 [30] (aqua), β subunit of RNAP −O2 (yellow), β subunit of RNAP +O2 (dark purple), and genomic coordinates. Locations of FNR binding sites are also shown: predicted FNR binding sites (red lines), FNR ChIP-seq peaks (black lines), FNR peaks upstream of operons showing a FNR-dependent change in expression (blue lines), FNR peaks co-activated by NarL/NarP (green lines), FNR peaks co-activated by CRP (purple lines), and FNR peaks repressed by Fur (yellow lines).

