
Figure 2. Precision-recall curve used to determine the prediction threshold of FNR binding sites and updated FNR PWM.
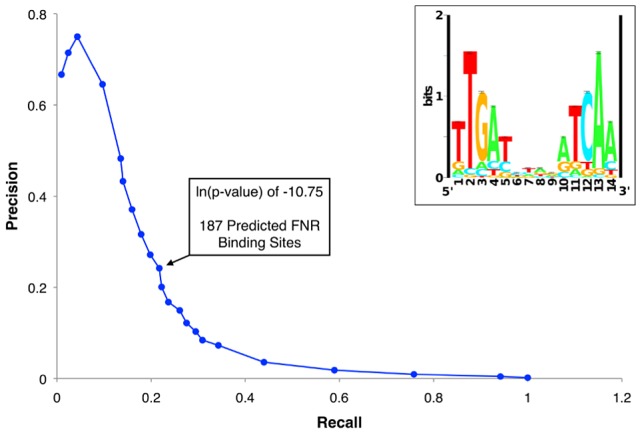
The precision-recall curve used to determine the optimal threshold for predicting high quality FNR binding sites throughout the genome. The precision and recall values were determined for many ln(p-value) thresholds using the PatSer algorithm and the optimal value is identified by the arrow. The inset shows the FNR position weight matrix (PWM) constructed from the FNR ChIP-seq peak sequences. The height (y-axis) of the letters represents the degree of conservation at that position within the aligned sequence set (in bits), with perfect conservation being 2 bits. The x-axis shows the position of each base (1–14) starting at the 5′ end of the motif.