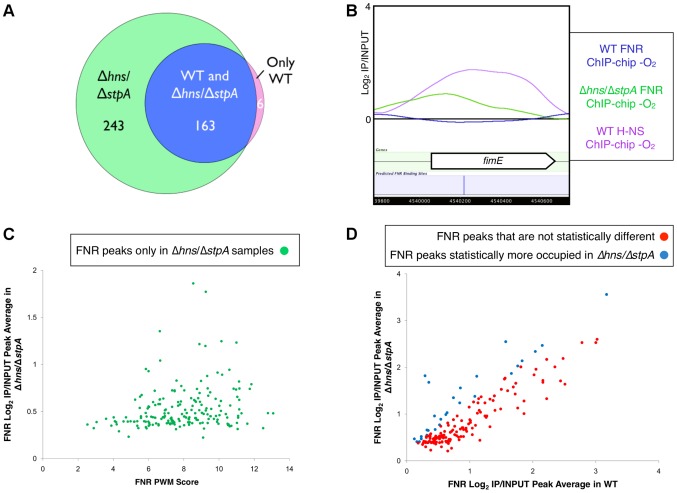
Figure 4. Identification of FNR occupancy in a Δhns/ΔstpA strain compared to WT.
A) Venn diagram showing the overlap of FNR peaks identified only in the WT strain (purple), in both the WT and the Δhns/ΔstpA strains (blue) or only in the Δhns/ΔstpA strain (green). B) Example of a high-quality predicted FNR binding site (blue line) within fimE that showed no FNR binding in the WT strain (blue trace), but did show enrichment of H-NS in the WT strain (purple trace). A FNR ChIP-chip peak was identified in the Δhns/ΔstpA strain (green trace) at the location of the predicted FNR binding site. C) The 193 FNR peaks found only in the Δhns/ΔstpA strain with a statistical increase in FNR occupancy in the Δhns/ΔstpA strain compared to the WT strain (p-value<0.05). Correlation of ChIP-chip peak average (log2(IP/INPUT) average) and the corresponding FNR PWM score (determined by PatSer [36]). D) Correlation of ChIP-chip peak averages (log2(IP/INPUT) average) for FNR ChIP-chip peaks found in both WT and Δhns/ΔstpA strains. Shown are peaks with no statistical difference in occupancy (red points) and those peaks that showed a statistical increase in FNR occupancy (blue points) in the Δhns/ΔstpA strain compared to the WT strain (p-value<0.05).

