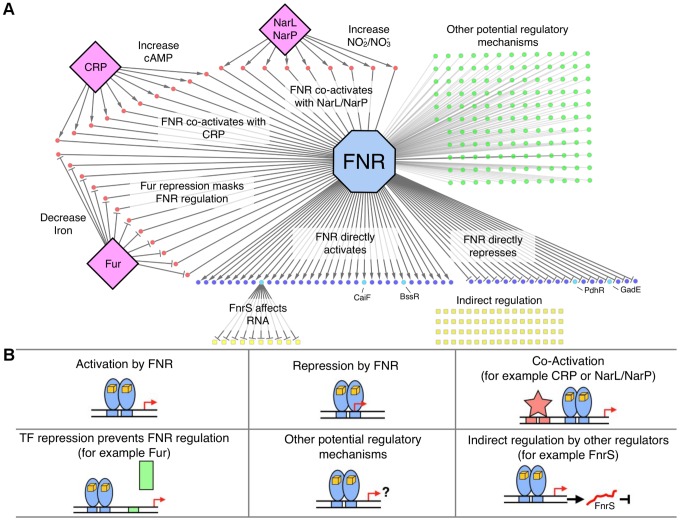
Figure 5. The FNR transcriptional network and categories of FNR regulation.
A) Graphical representation of the FNR transcriptional network. FNR is shown in the blue octagon, while other TFs (CRP, Fur, NarL) are shown as purple diamonds. Circles represent operons with an upstream FNR ChIP-seq peak, while squares represent operons indirectly regulated by FNR. Dark blue circles are operons directly dependent on FNR for expression, with the lighter blue circles representing FnrS other TFs (CaiF, BssR, PdhR, GadE) that potentially control the indirect regulon, shown by yellow squares. Red circles are operons known or predicted to be co-regulated by FNR and other TFs, while green circles have other potential regulatory mechanisms with FNR. B) Each box represents different categories of FNR regulation identified in this study. Categories 1 and 2 (upper left and middle boxes) show direct activation and repression of operons by FNR (blue ovals). Category 3 (upper right box) show co-activation by other TFs (red star; e.g. CRP, NarL, NarP) and Category 4 (lower left box) shows TF repression that prevents FNR regulation (green rectangle; e.g. Fur). Category 5 (lower middle box) represents operons with other possible regulatory mechanisms with FNR and Category 6 (lower right box) shows the subset of the indirect regulon affected by other TFs and, for example, by the small, regulatory RNA FnrS (red line).

