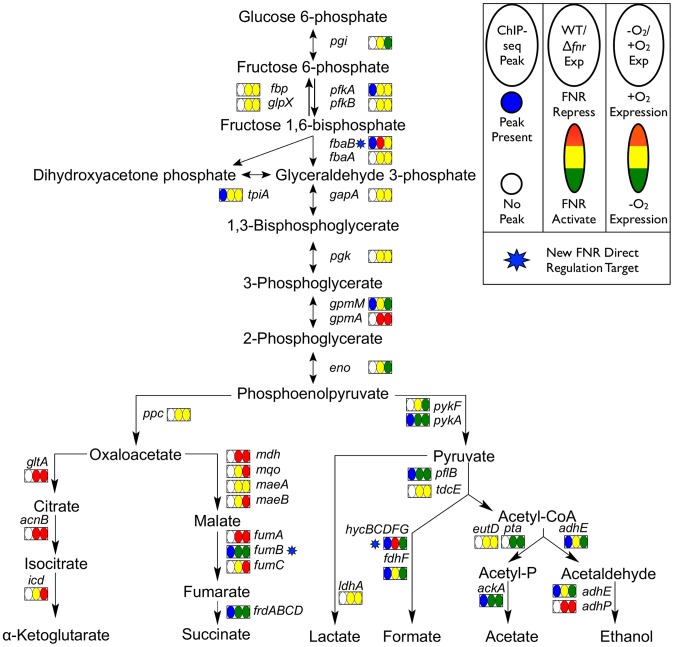
Figure 6. Glycolysis and mixed acid fermentation pathway overlaid with FNR and O2 regulation.
Pathway map showing the glycolysis and mixed acid fermentation pathway overlaid with FNR ChIP-seq peak occupancy and expression changes [124]. Reactions are represented by arrows connecting metabolites and each operon is represented by a box with three ovals. The first oval of each box indicates the presence (blue) or absence (white) of a FNR ChIP-seq peak upstream of that operon. The color of the second oval indicates the impact of FNR on the expression of the operon (red is FNR repression, while green is FNR activation). The color of the third oval indicates the expression under WT aerobic and anaerobic growth conditions (red is WT aerobic expression, while green is WT anaerobic expression). The blue stars indicate newly identified direct targets of FNR regulation within this pathway.

