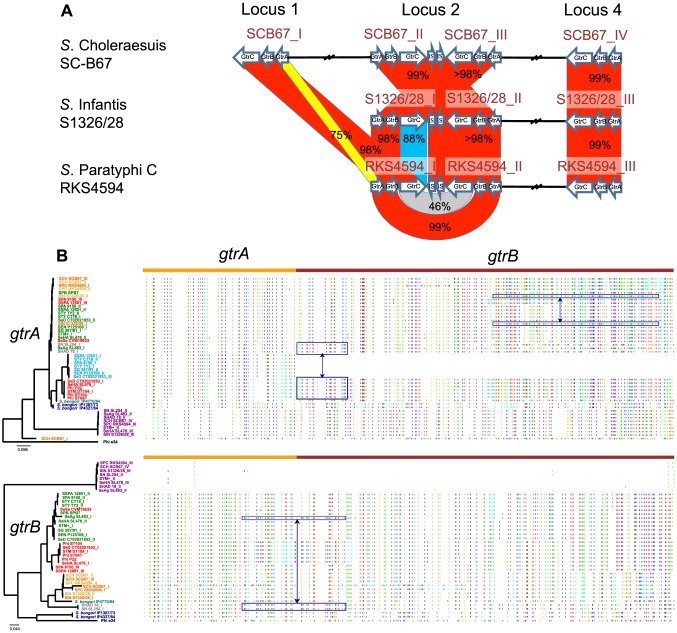
Figure 2. Extensive recombination withingtr operons.
A) Schematic representation of a BLAST comparison between the gtr operons from three Kaufmann-White serogroup C1 genomes; S. Paratyphi C, S. Infantis and S. Choleraesuis. Red shaded regions indicate gene products with >98% protein similarity; blue regions <90% similarity; yellow regions <80% similarity and Grey regions <50% similarity as determined by ClustalW2 amino acid alignments [42]. A possible gtr recombination is evident between the gtrA or gtrBC of S. Choleraesuis gtr SCB67_I and the gtrA or gtrBC of S. Paratyphi C gtr RKS4594_I gtr operons. S. Choleraesuis gtr SCB67_I is encompassed within a full-length P22-like prophage termed Scho1 [11]. Genome integration sites as depicted in Figure 3 are represented above the Figure. IS refers to insertion-like sequences. B) Mapping of homoplasic SNPs within gtrA and gtrB gene sequences. On the left of the figure is the mid-point rooted phylogeny of the gtrA and gtrB gene sequences with gene names colored according to GtrC Family designation (Figure 1). Colored vertical lines depict homoplasic bases (red:A, blue:T, green:C, orange:G) that differ from the ancestral sequence and are shown relative to the concatenated gtrAB gene sequence shown on top. The pattern of lines represents a homoplasic ‘barcode’ of similarity between strains and is used to indicate recombined regions. High homoplasic SNP density across both gtrA and gtrB genes indicates a dynamic and complex evolutionary history driven by extensive recombination. Some examples of recombined regions are indicated by blue boxes. In the case of S. Agona gtr SL483_I and S. Hadar gtr 18_I/S. Newport gtr SL254_I, recombination is not restricted by gtrAB gene boundaries.

