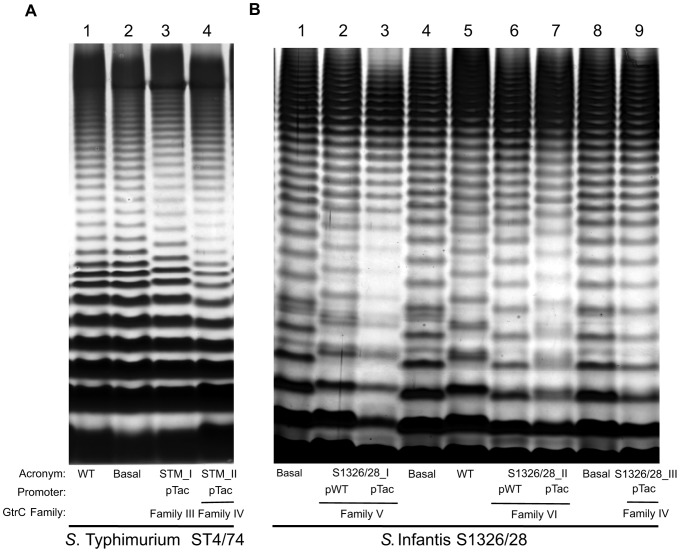
Figure 5. Lipopolysaccharide profiling of four GtrC families from twoS. enterica subspecies I serovars.
A) S. Typhimurium strain ST4/74 lipopolysaccharide (LPS) comparing the banding profiles of wildtype (WT) LPS to LPS from an ST4/74 strain devoid of all known LPS modification genes termed ‘basal’ (delta gtr STM_I, delta gtr STM_II and delta oafA); and mutant strains expressing a single gtr operon gtr STM_I (GtrC family III) and gtr STM_II (GtrC family IV) driven by its native promotor, pWT, or the constitutive promoter pTac. B) S. Infantis strain S1326/28 LPS profiles of GtrC family V and family VI operons in comparison to LPS profiles from WT and basal (delta gtr S1326/28_I, gtr S1326/28_II and gtr S1326/28_III) S. Infantis strains. LPS was extracted from overnight bacterial cultures and visualized on silver stained TSDS-PAGE gels. A change in the size of LPS banding patterns is used to infer functionality of gtr operons.

