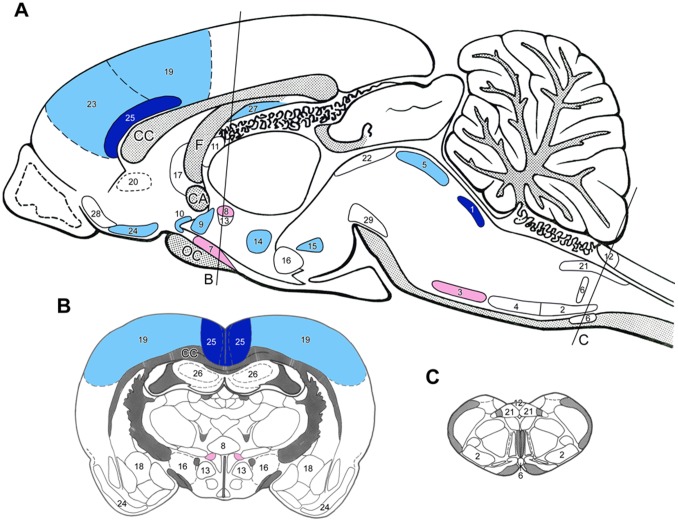
Figure 1. Sagittal (A) and coronal (B and C) drawings of the rat brain with the topography of brain nuclei and areas where neurons responded to experimental chronic renal failure (4/6 nephrectomy) with moderate to high expressions of Fos as compared to sham-operated animals.
The rostro-caudal levels of the coronal sections are indicated on Fig. A). Dark blue = highly, light blue = moderately elevated Fos activation, red = highly, light red = moderately depleted Fos activation. (For the level of numerical changes see Table 2.) Abbreviations: CA – anterior commissure, CC – corpus callosum, F – fornix. Brain nuclei and areas: 1 – locus coeruleus, 2 – A1 noradrenaline cell group, 3 – A5 noradrenaline cell group, 4 – C1 adrenaline cell group, 5 – dorsal raphe nucleus, 6 – medullary raphe nuclei, 7 – supraoptic nucleus, 8 – hypothalamic paraventricular nucleus (magnocellular portion), 9 – preoptic AV3V area, 10 – organum vasculosum laminae terminalis (OVLT), 11 – subfornical organ, 12 – area postrema, 13 – hypothalamic paraventricular nucleus (parvocellular portion), 14 – hypothalamic dorsomedial nucleus, 15 – supramamillary nucleus, 16 – lateral hypothalamic area, 17 – lateral septum, 18 – central amygdala nucleus, 19 – somatosensory cortex, 20 – viscerosensory cortex (insula), 21 – nucleus of the solitary tract, 22 – periaqueductal gray matter (PAG), 23 – prefrontal cortex, 24 – piriform cortex, 25 – anterior cingulate cortex, 26 – hippocampus (CA1-3), 27 – subiculum, 28 – olfactory tubercle, 29 – substantia nigra/VTA dopamine neurons.

