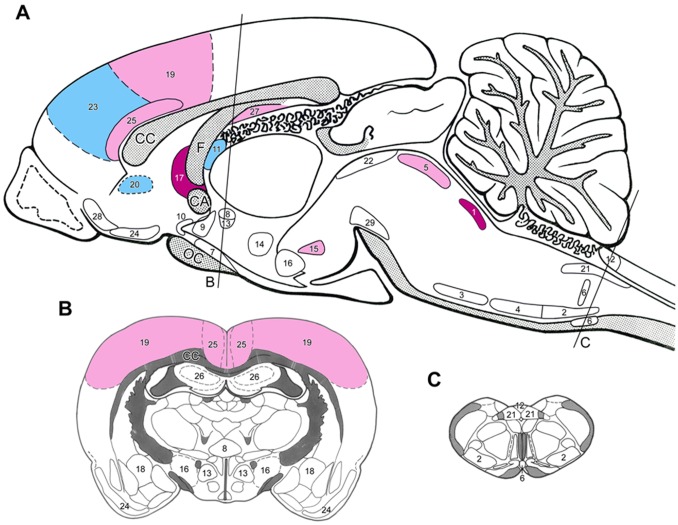
Figure 2. Sagittal (A) and coronal (B and C) drawings of the rat brain with the topography of brain nuclei and areas where nephrectomized rats responded with losartan treatment with moderate to high expressions of Fos as compared to placebo-treated nephrectomized animals.
The rostro-caudal levels of the coronal sections are indicated on Fig. A). Dark blue = highly, light blue = moderately elevated Fos activation, red = highly, light red = moderately depleted Fos activation. (For the level of numerical changes see Table 2.) Abbreviations and numbers: see Fig. 1.

