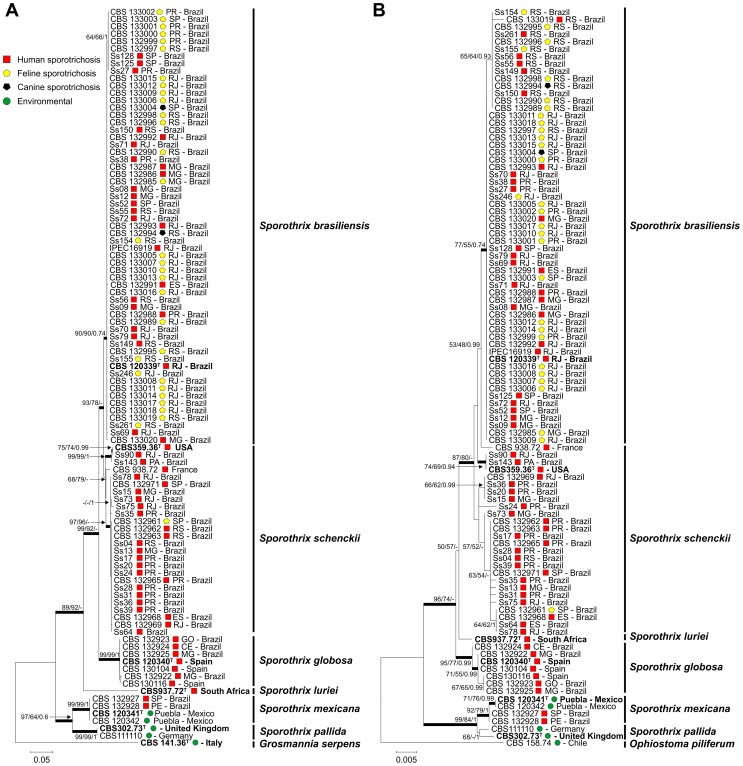
Figure 3. Phylogenetic trees generated by Neighbor-joining, Maximum Likelihood and Bayesian analysis using partial nucleotide sequences of the calmodulin-encoding gene (A) and the translation elongation factor-1 alpha (EF1α) locus region (B).
Bootstrap and posterior probabilities values were added to respective branches (NJ/ML/BI). Each species are indicated at each respective position at the phylogenetic tree. Calmodulin and EF1α accessions number are indicated in the Table 1.

