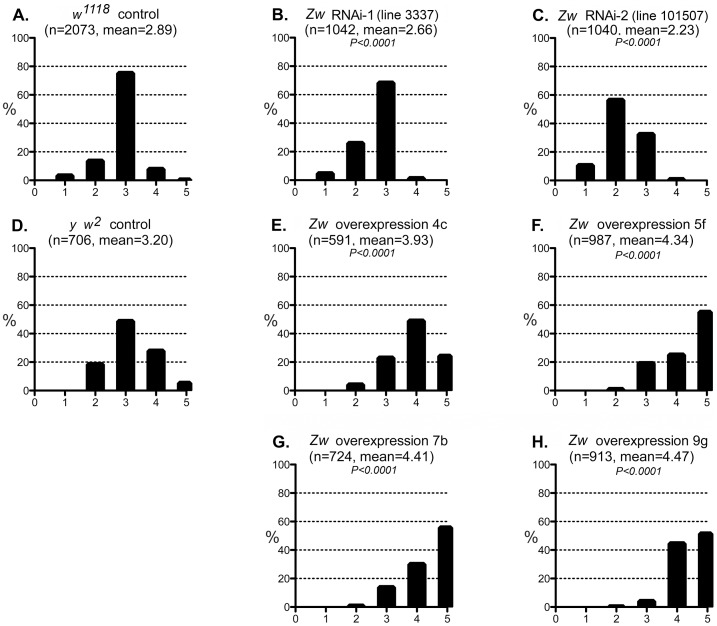
Figure 5. Effect of G6PD variation on the CryABR120G phenotype.
A–C: The phenotypic distribution produced by GMR>CryABR120G in a w1118 control strain background (A), and the altered distributions produced by RNAi-mediated knockdown of Zw (B, C). D-H: The CryABR120G phenotypic distribution in a y w2 control background (D) compared to phenotypes when Zw is overexpressed (E–H). The number of eyes scored is given as n; P is given for comparison with the appropriate control (A for B, C; D for E–H). Controls were chosen to most closely match the genetic background of the test strains. The CryABR120G line 16A was used for these tests.

