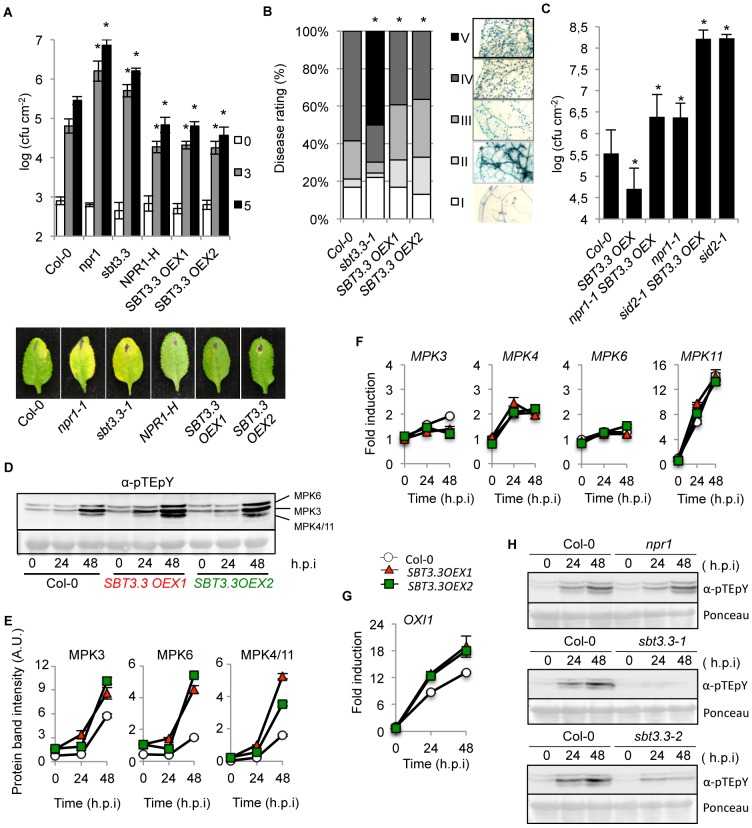
Figure 5. SBT3.3 overexpression confers enhanced disease resistance and enhanced mitogen-activated kinase activation.
(A) Plants of the indicated genotype were inoculated with PsDC3000. Zero (white bars), three (grey bars) and five (black bars) days after inoculation, the bacterial growth was measured. Error bars represent standard deviation (n = 12). Asterisks indicate statistical differences to Col-0 (P<0.05) analysed with a Student's t-test. Below are shown representative pictures of leaves of the inoculated plants genotypes. (B) Quantified H. arabidopsidis conidia development on leaves of the indicated genotypes. Asterisks indicate statistically different distributions of disease severity classes compared with Col-0 plants (χ2 test; α = 0.05). (C) Disease resistance phenotype of homozygous double npr1 SBT3.3OEX1 and sid2 SBT3.3OEX1 mutant plants against PsDC3000 was compared to Col-0 and to their respective parental lines. Experiments were performed as described in Figure 2A. (D) Western blot with anti-pTEpY antibodies of crude protein extracts derived from Col-0, SBT3.3OEX1 and SBT3.3OEX2 plants at 0, 24, and 48 h.p.i with PsDC3000. Equal protein loading was check by Ponceau staining of the nitrocellulose filter. MAP6, MPK3 and MPK4/11 migrating bands are indicated on the right. The experiments were repeated three times with similar results. (E) Densitometric scan quantification of protein bands corresponding to MPK3, MPK6 and MPK4/11 bands as shown in (D) following inoculation of Col-0 (white), SBT3.3OEX1 (red) and SBT3.3OEX2 (green) plants with PsDC3000. Data represent the mean ± SD; n = 3 replicates. (F–G) Time-course RT-qPCR analysis showing MPK3, MPK4, MPK6, MPK11 (F) and OXI1 (G) gene expression in the indicated genotypes following inoculation with PsDC3000. Data represent the mean ± SD; n = 3 replicates. Expression was normalized to the constitutive ACT2 gene expression as in Fig. 1. (H). Western blot with anti-pTEpY antibodies of crude protein extracts derived from Col-0, npr1, sbt3.3-1 and sbt3.3-2 plants at 0, 24, and 48 h.p.i with PsDC3000. Equal protein loading was check by Ponceau staining of the nitrocellulose filter. The experiments were repeated three times with similar results.

