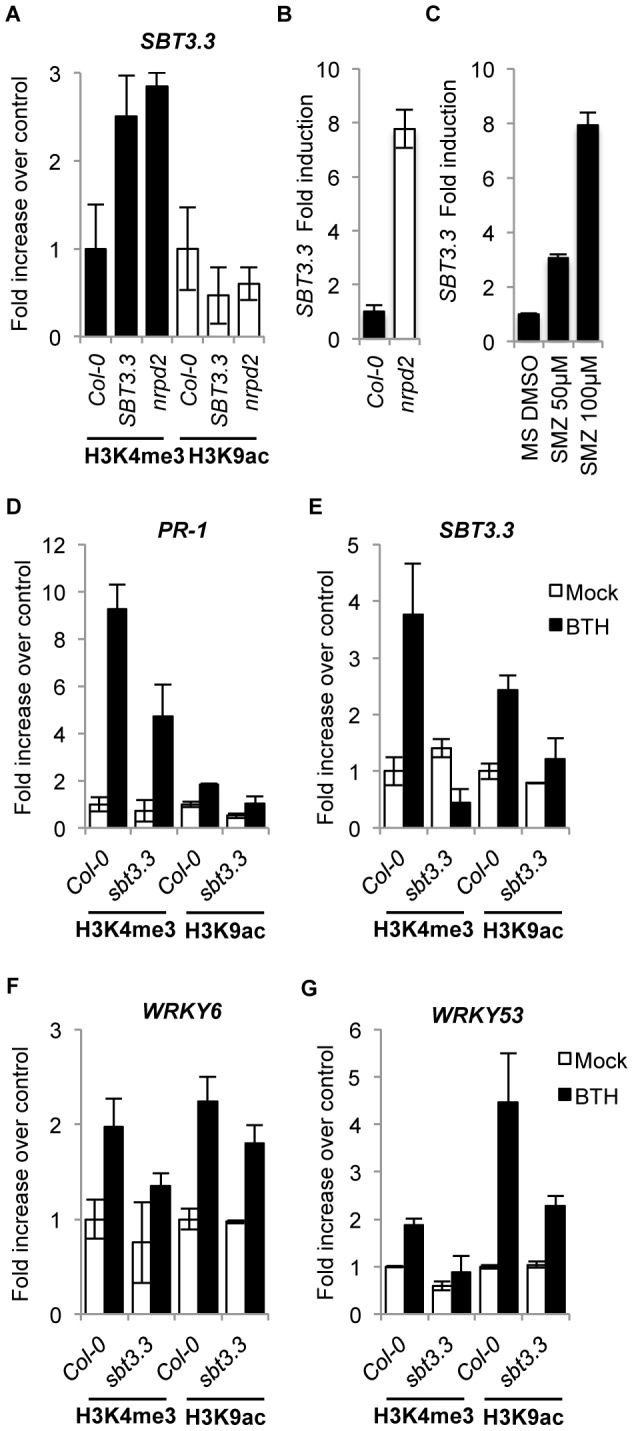
Figure 7. SBT3.3 expression promotes chromatin remodeling and is under epigenetic control.

(A) Comparative level of H3K4me3 and H3K9ac mark setting on the SBT3.3 gene promoter as present in leaf samples from Col-0, SBT3.3OEX1 and nrpd2 plants. Data are standardized for Col-0 histone modification levels. Data represent the mean ± SD; n = 3 biological replicates. (B) RT-qPCR of SBT3.3 transcript levels in Col-0 and nrpd2 plants. Data represent the mean ± SD; n = 3 biological replicates. Expression was normalized to the expression of the constitutive ACT2 gene and then to the expression in Col-0 plants. (C) RT-qPCR of SBT3.3 transcript levels in Col-0 seedlings upon treatment with 50 µM and 100 µM of sulfamethazine (SMZ) compared to mock (DMSO). Data represent the mean ± SD; n = 3 biological replicates. Expression was normalized to the expression of the constitutive ACT2 gene, then to mocked Col-0 plant expression. (D–G) Comparative level of H3K4me3 and H3K9ac mark setting on PR-1 (D), SBT3.3 (E), WRKY6 (F) and WRKY53 (G) gene promoters in Col0 and sbt3.3 plants following treatment with 100 µM BTH compared to buffer alone (mock). Data represent the mean ± SD; n = 3 biological replicates.
