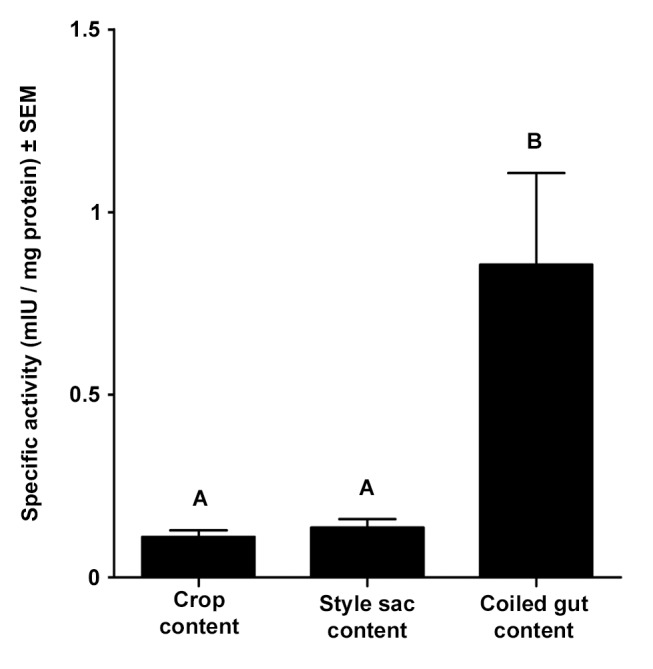
Figure 2. Specific protease activity in extracts of digestive tract contents.

Different letters indicate statistically significant differences between groups (mean ± SEM, N = 10, Kruskal –Wallis test followed by Dunn’s test, p<0.05).

Different letters indicate statistically significant differences between groups (mean ± SEM, N = 10, Kruskal –Wallis test followed by Dunn’s test, p<0.05).