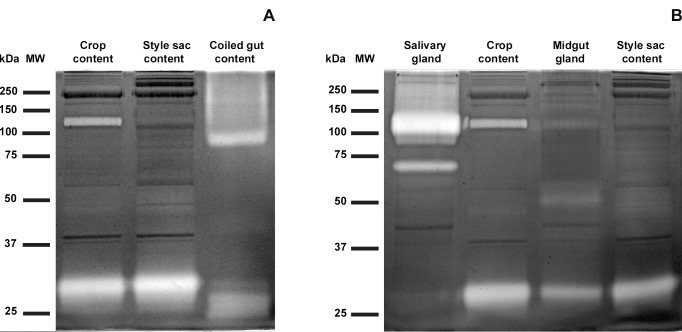
Figure 4. Diversity and tissue origin of digestive tract proteases.
Zymographies (10% polyacrylamide gels copolymerized with 1 mg/mL gelatin) showing protease activity (clear bands where gelatin was digested) and proteins with no protease activity (dark bands); Coomassie Brilliant Blue staining. (A) High and low molecular weight bands showing protease activity in digestive tract contents. (B) Correlative protease activity in salivary gland tissue and crop content, and in midgut gland tissue and style sac content. MW = molecular weight markers. Each lane was loaded with 75 µg of protein.

