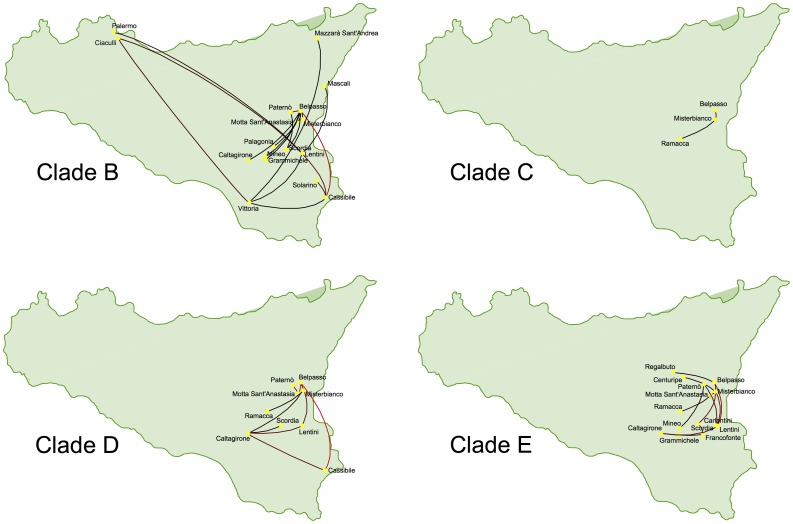
Figure 4. Inferred migration graph for the different introductions of CTV in Sicily associated to clades B, C, D and E reconstructed from the MCC tree.
The branches are colored according to the node height values to the colors between the specified maximal (red) and minimal boundary (black). Only introductions associated to clades B, C, D and E are shown since clade A has only a single Sicilian isolate.

