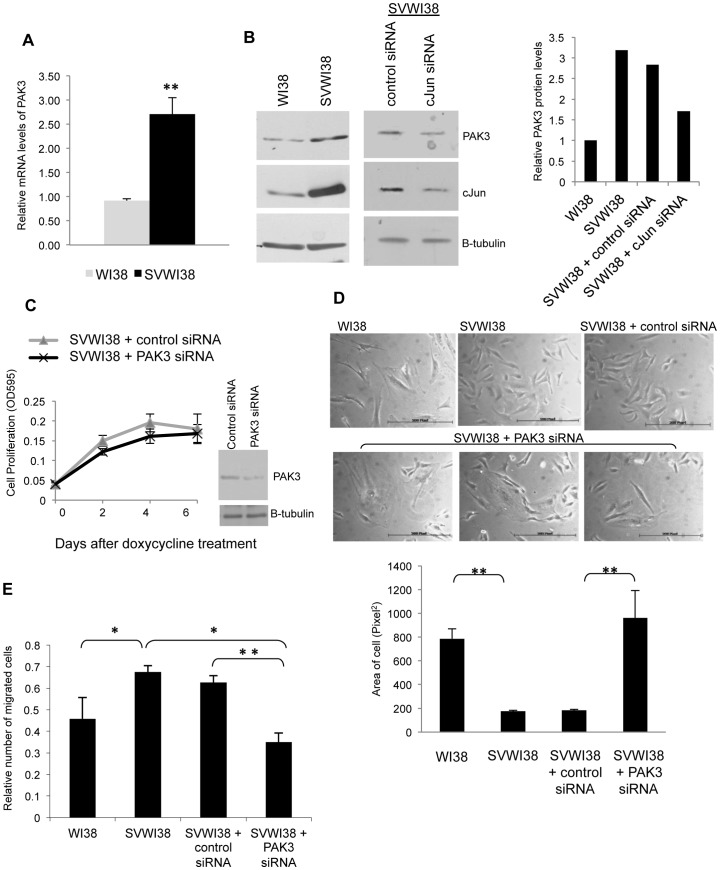
Figure 6. PAK3 expression is elevated in transformed SVWI38 fibroblasts and plays a role in their cell morphology and migration.
A: Real time RT-PCR for PAK3 mRNA expression levels in normal, WI38, and transformed lung fibroblasts, SVWI38. The results show the mean±S.E. of at three independent experiments. (*p≤0.05 and **p≤0.01) B: Western blot analysis showing PAK3 and cJun expression in normal, WI38, and transformed lung fibroblasts, SVWI38, as well as in SVWI38 cells with transient knock-down of cJun using siRNA. The bar graph represents the quantitated levels of PAK3 protein relative to β-tubulin. C: Cell proliferation assays for SVWI38 cells transfected with control-A or PAK3 siRNA. The results show the mean±S.E. of experiments performed in quadruplicate. Inset: Western blot analysis shows the transient PAK3 knock-down using PAK3 siRNA in SVWI38 fibroblasts assayed. D: Phase contrast microscopy showing the morphology of WI38 fibroblasts compared to SVWI38 fibroblasts transfected with control-A or PAK3 siRNA after 48 hours. The bar graph shows the mean area (pixel2)±S.E. of sixty cells of each condition over six fields of view quantitated with AxioVision 4.7 software. (**p≤0.01). E: Transwell motility assays measuring the number of migrating cells of WI38 compared to SVWI38 cells transfected with control-A or PAK3 siRNA. The results show the mean ± S.E. of the mean of experiments performed in triplicate and repeated. (**p≤0.01).

