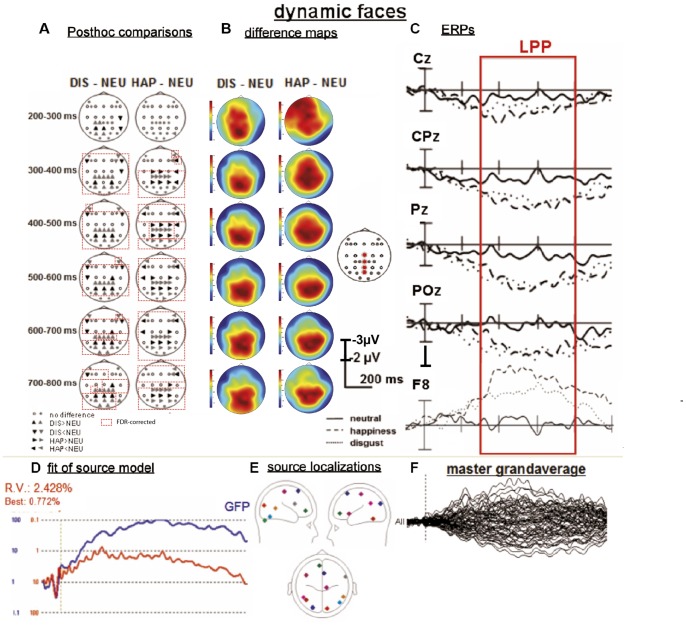
Figure 3. Results of ERP and fMRI constrained source analysis of dynamic facial expressions.
(A) posthoc comparisons for six selected time windows (dependent t-tests, p<.05). Dashed red boxes represent significant results after FDR-correction. (B) Topographical maps of difference waves for disgust (DIS)>neutral (NEU) and happiness (HAP)>NEU and neutral alone. (C) ERPs for selected posterior midline and anterio-lateral electrode positions. Red box indicates the analyzed time window of the LPP. Source model of dynamic stimuli: (F) master grand-average over all electrodes and all conditions (−100–1000 ms), (D) Global field power curve (GFP; blue curve) and explained variance of the model (residual variance [RV] and best fit; red curve), (E) Twelve RS (each displayed in individual color) projected onto a 4-shell spherical model displayed from six different perspectives (saggital [left, right], transversal [above, below], coronal [back, front]). Note: RS one to eleven were seeded based on fMRI activations and RS twelve was added by sequential fitting procedure.

