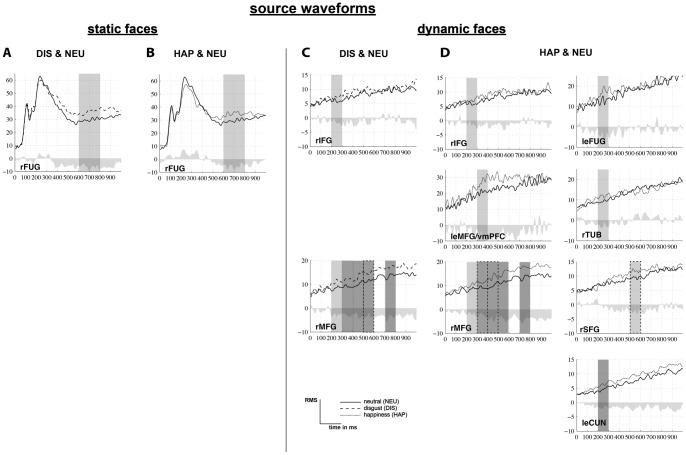
Figure 4. Source waveforms of significantly different RS-activations.
Source waveforms (root mean square (RMS) curve of each regional source) are displayed over time (0-1000ms) for each condition (solid line = neutrality (NEU), dashed line = disgust (DIS), dotted line = happiness (HAP). Significant RS-activations are based on ANOVAs (light grey: significant at p<.05, dark grey: trend to significance at p<.1) and post hoc comparisons (box: no frame: p<.05, dashed frame: p<.1) for static (A) DIS > NEU, (B) HAP > NEU and dynamic facial expressions (C) DIS > NEU (D) HAP > NEU. Abbreviations: le = left, r = right, CUN = cuneus, FUG = fusiform gyrus, IFG = inferior frontal gyrus, MFG = medial frontal gyrus, SFG = superior frontal gyrus, TUB = tuber, vmPFC = ventromedial prefrontal cortex (medial frontal gyrus).

