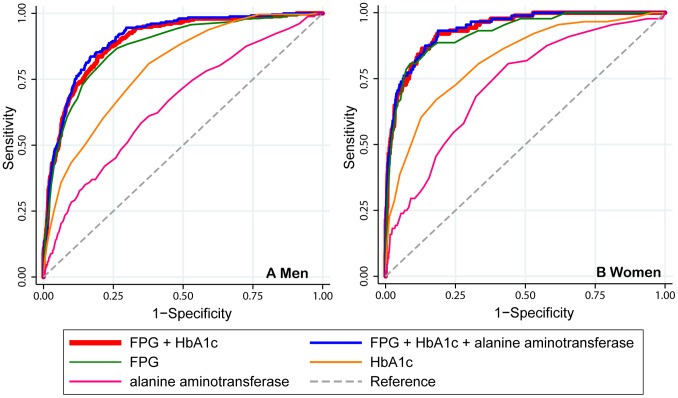
Figure 2. Receiver operating characteristic curves for variables predicting diabetes.
The graphs only show glycaemic biomarkers (FPG and HbA1c), and the non-glycaemic biomarker, alanine aminotransferase, which had the highest area under the receiver operating characteristic curves in the additional models. FPG, fasting plasma glucose; HbA1c, hemoglobin A1c.

