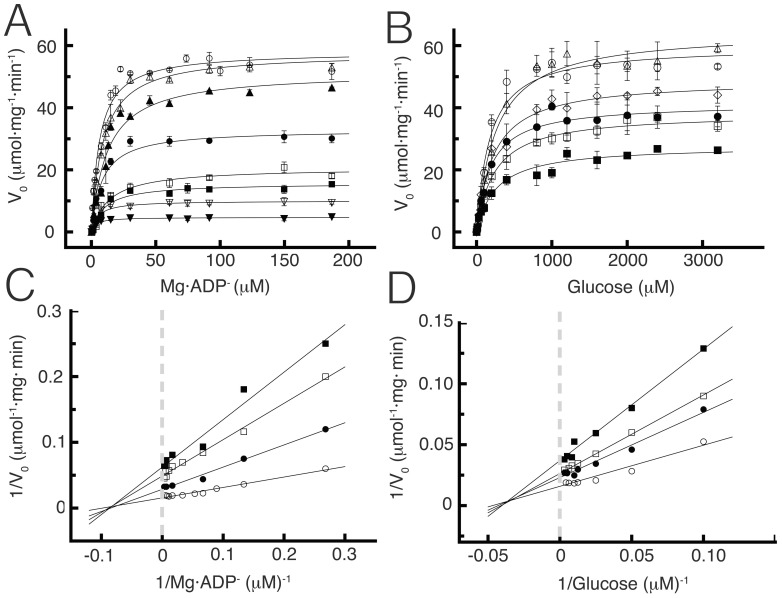
Figure 1. Initial velocity patterns for TlGK with D-glucose and MgADP as variable substrates.
(A) Saturation curves for Mg·ADP at different constant concentrations of D-glucose. The fixed initial D-glucose concentrations were: 30 µM (▾), 50 µM (▿), 100 µM (▪), 150 µM (□), 200 µM (•), 250 µM (▴), 500 (▵) and 1000 µM (○). (B) Saturation curves for D-glucose at different constant MgADP concentrations; 10 µM (▪), 30 µM (□), 50 µM (•), 100 µM (◊), 300 µM (▵) and 1000 µM (○)MgADP. (C) Double reciprocal plots of curves shown in A. For clarity only four concentrations are depicted: 100, 150, 200 and 1000 µM D-glucose. (D) Double reciprocal plots of curves shown in B. For clarity only four concentrations are shown: 10, 30, 50 and 1000 µM Mg·ADP.

