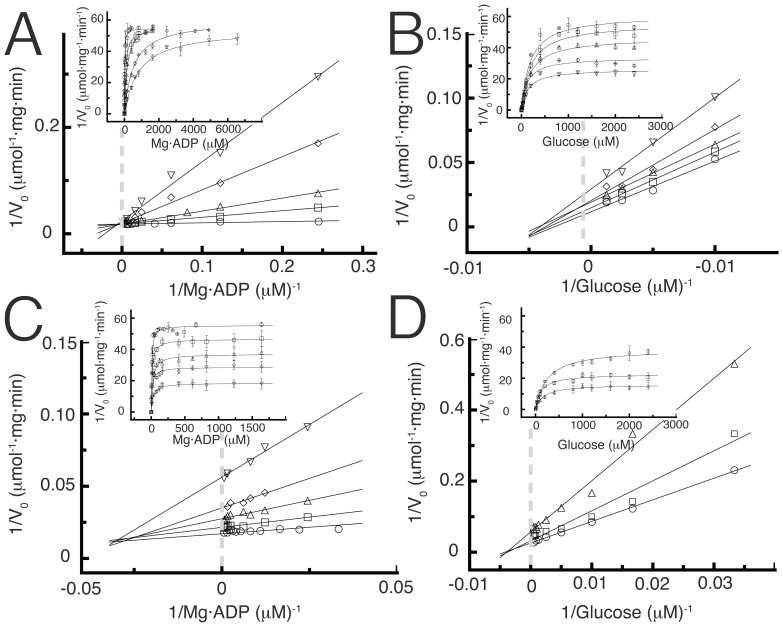
Figure 2. Product inhibition patterns for TlGK.
(A) Inhibition by Mg·AMP with Mg·ADP as variable substrate. Measurements were assayed at fixed Mg·AMP concentrations: 100 µM (□), 200 µM (▵), 600 µM (◊) and 1000 µM (▿). Control curve in absence of product (○) was also included in the graph. (B) Inhibition by Mg·AMP with D-glucose as variable substrate. Measurements were assayed at fixed concentrations of Mg·AMP: 435 µM (□), 858 µM (▵), 1738 µM (◊) and 3657 µM (▿). Control curve in the absence of product (○) was also included in the graph. (C) Product inhibition by glucose-6-P with Mg·ADP as variable substrate. Measurements were assayed at fixed glucose-6-P concentrations: 100 µM (□), 500 µM (▵), 1000 µM (◊) and 2000 µM (▿). Control without the product was included (○). (D) Product inhibition by D-glucose-6-P with D-glucose as variable substrate. Measurements were assayed at fixed glucose-6-P concentrations: 500 µM (□) and 2000 µM (▵). Control curve without the presence of product was included (○). Inset of all figures show the non-linear fit of the total data.

