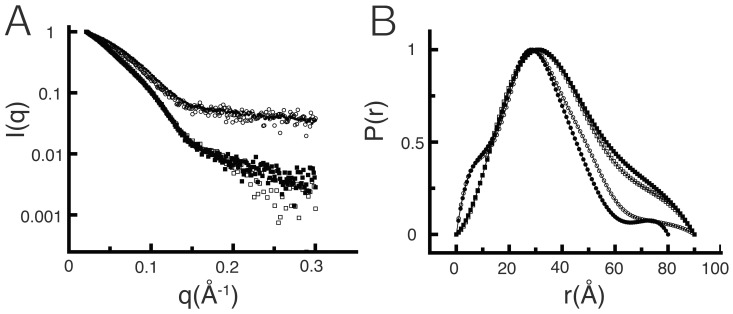
Figure 4. Scattering curves and pair distance distribution functions P(r).
(A) Scattering patterns for the different conditions explored: apoenzyme (□), enzyme-D-glucose (▪), enzyme-Mg·ADP (○) and in the presence of Mg·ADPβS and glucose (•). The curves were normalized to unity at their maximum value for comparison purposes. (B) P(r) graphs for each condition calculated by Fourier transformation using GNOM (28). The graphs were normalized to unity at their maximum value for comparison purposes.

