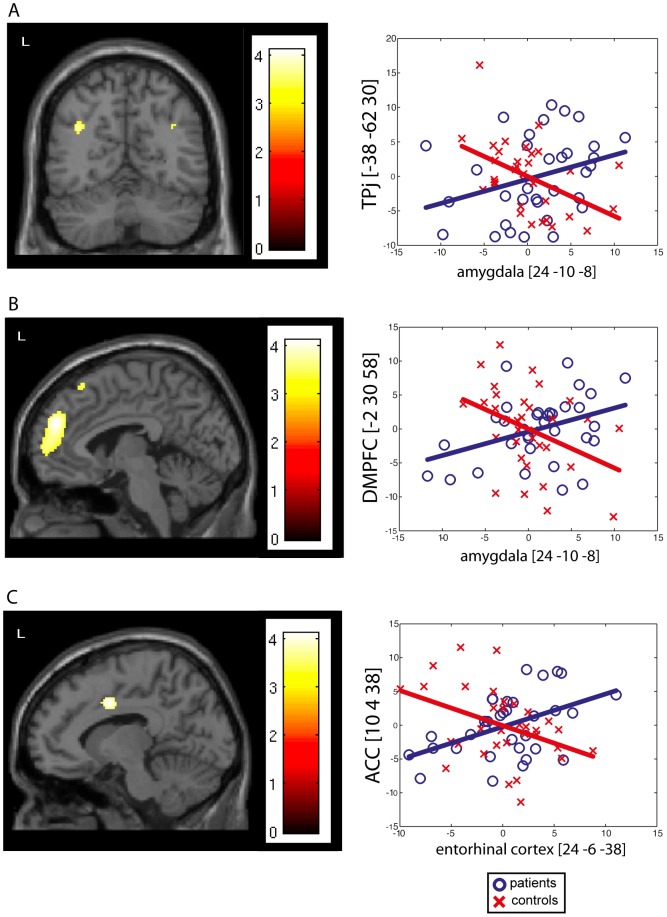
Figure 2. Significant increases in effective connectivity.
Significant increases in connectivity were mainly found between the non-epileptic AHC and (A) the anterior cingulate cortex ([10 4 38], Pearson's correlation: r = 0.47, p = 0.003), (B) the dorsal medial prefrontal cortex ([−2 30 58], Pearson's correlation: r = 0.38, p = 0.004), and (C) the temporo-parietal junction ([−38 −62 30], Pearson's correlation: r = 0.31, p = 0.004). Regression plots (right side of the figure) of the metabolic activity in the non-epileptic AHC and these DMN areas were obtained in control subjects (red crosses) and in the group of patients (blue circles). These regression plots illustrate the epilepsy-induced changes in the contribution of the non-epileptic AHC to the level of metabolic activity in these DMN areas.

