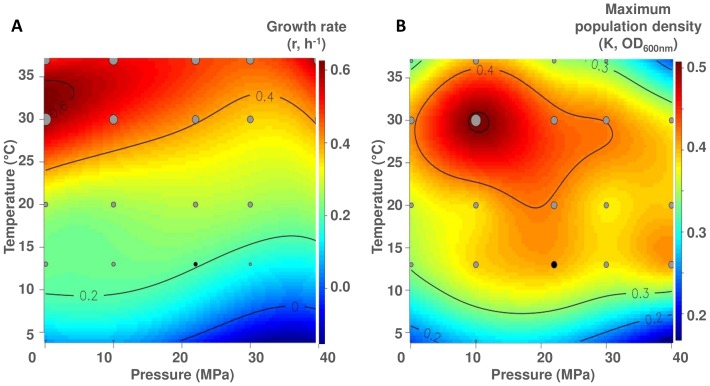
Figure 3. Extrapolated-contour diagram of the temperature-pressure dependence of P. phosphoreum ANT-2200.
The diagrams are plotted for (A) the growth rate (r, h-1) and (B) the maximum population density (K, OD600 nm). The grey circles indicate parameter values used to extrapolate the contours. Size is proportional to their value. The black circle corresponds to the in situ conditions for the strain. Isolines define zones with same level of parameter values.

