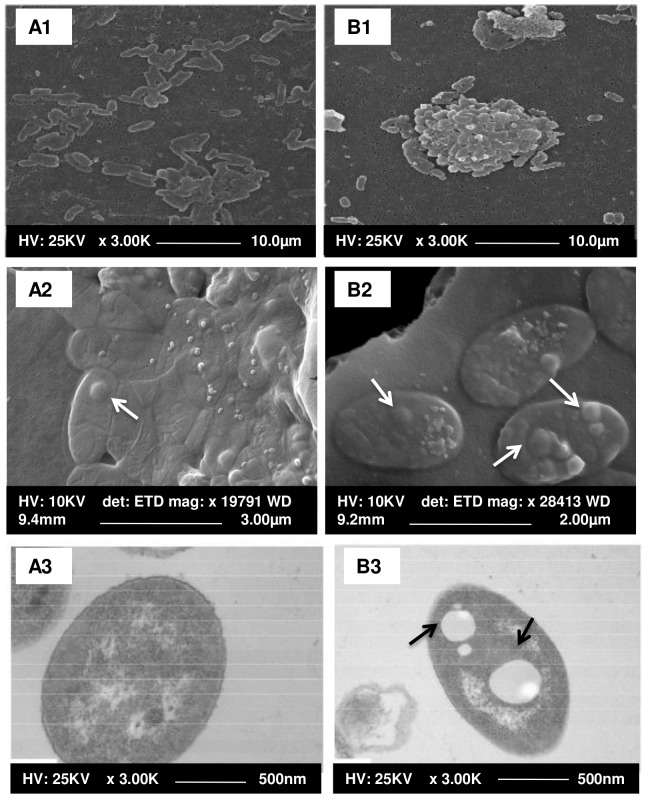
Figure 5. Micro-photographs of P. phosphoreum ANT-2200 cells by electron microscopy.
Observation at 0.1 MPa (A1 on dehydrated samples, A2 on freeze-dried samples) and 22 MPa (B1 on dehydrated samples, B2 on freeze-dried samples) using SEM and at 0.1 MPa (A3) and 22 MPa (B3) using TEM. Intracellular inclusions are indicated by arrows.

