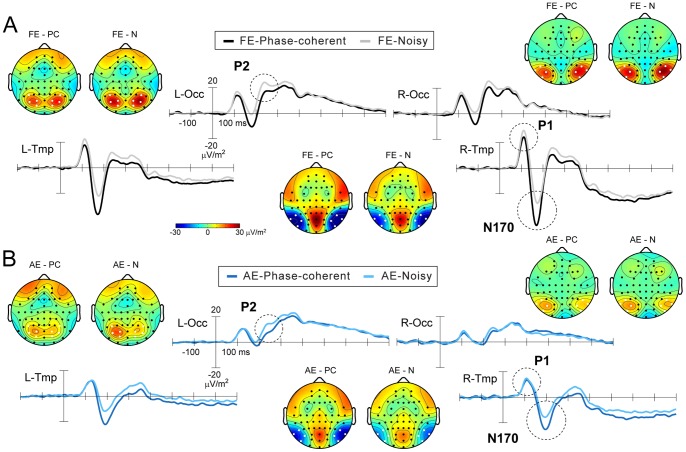
Figure 2. Grand-average event-related potentials (ERP) to faces from (A) the fellow and (B) the amblyopic eye.
Trial-averaged waveforms are displayed as clusters averaged from electrodes marked with white dots on the topographical maps. Peak topographic maps are displayed at the time of their respective maxima/minima. P1 and N170 were analyzed over bilateral temporal clusters (L/R-Tmp) while P2 was analyzed over bilateral occipital clusters (L/R-Occ). Note, that cartoon heads are plotted with unrealistic head radius for better electrode visibility. FE: fellow eye, AE: amblyopic eye, PC: phase-coherent, N: noisy.

