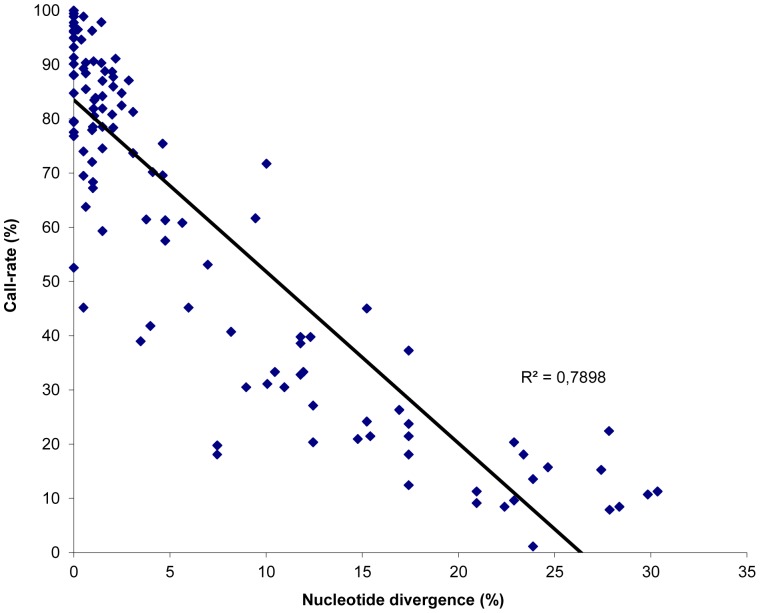
Figure 2. Detection spectrum of the PathogenID_v2.0 according to the nucleotide diversity of the tested BoNT-producing strains.
The spectrum of detection of BoNT-producing clostridia by the PathogenID v2.0 was assessed using 9 well-characterized strains representative of all toxinotypes and several toxin A subtypes. Each sequence obtained by the RMA for which the percentage of nucleotide divergence compared to the corresponding tiled sequence is known (n = 118), is indicated by a blue diamond, and presented according to the percentage of nucleotide bases determined by the RMA (call rate). The linear association between these two parameters is shown, and demonstrates a good correlation (correlation coefficient R2 of 0.79).

