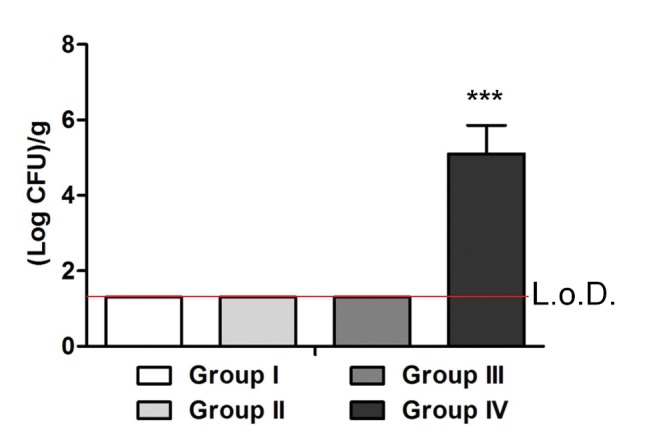
Figure 8. Bacterial load in bones of all experimental groups.

The histogram compares the bacterial counts in the infected and control mice. After inoculation with an infecting dose of 1×10³ CFU/mouse, no colonies were detected in groups I, II and III. In contrast, a mean of 5.1±1.5 (Log CFU)/g of bone in the femoral canal was found in group IV (L.o.D. = limit of detection), which was statistically different from the other groups, as analyzed with one-way ANOVA and Bonferroni’s post-hoc (***P<0.0001; n = 4).
