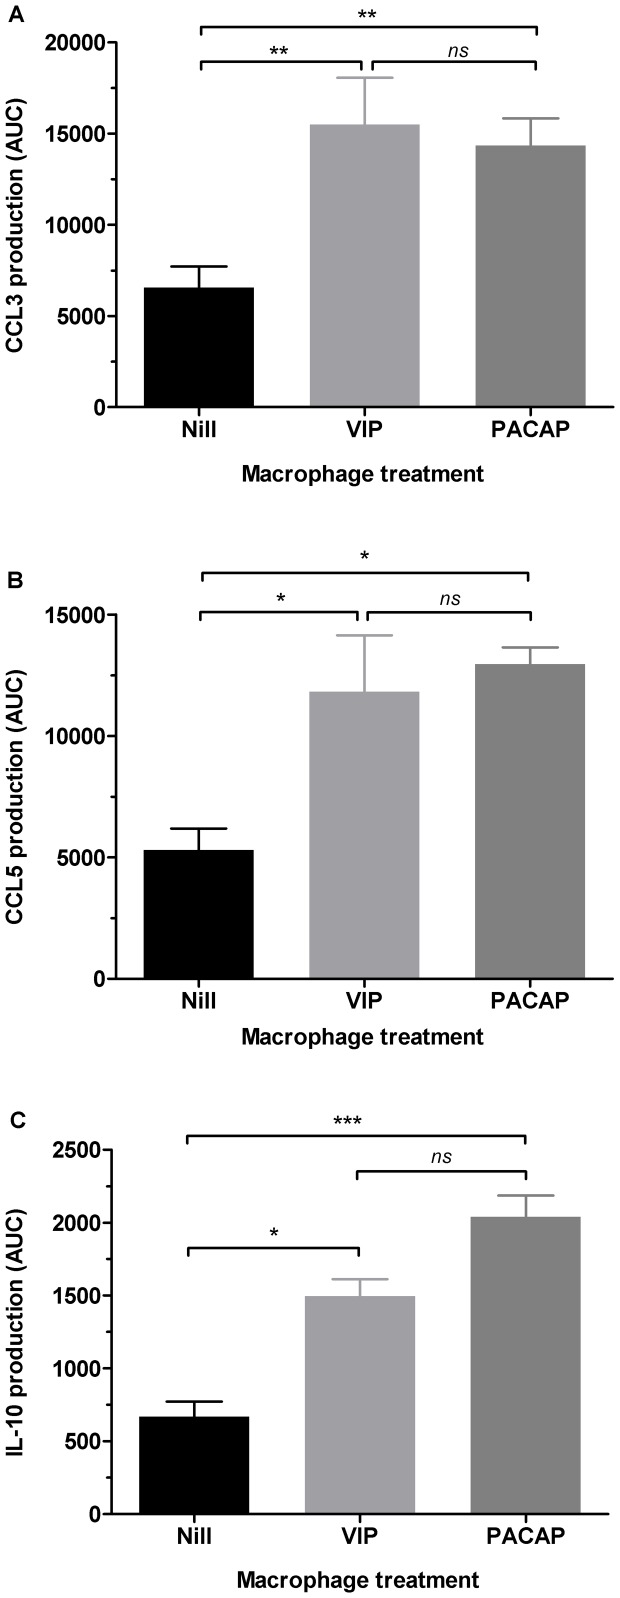
Figure 6. VIP and PACAP induce CCL3, CCL5 and IL-10 production in macrophages.
. Figure shows the production of CCL3 (A), CCL5 (B) and IL-10 (C) by area under the curve (AUC) analysis, which was calculated based on the respective concentrations measured by ELISA (See Figure S1). Data represent means ± SEM of six (CCL3) and four (CCL5 and IL10) independent experiments. *p≤.05; **p≤.01; ***p≤.001.

