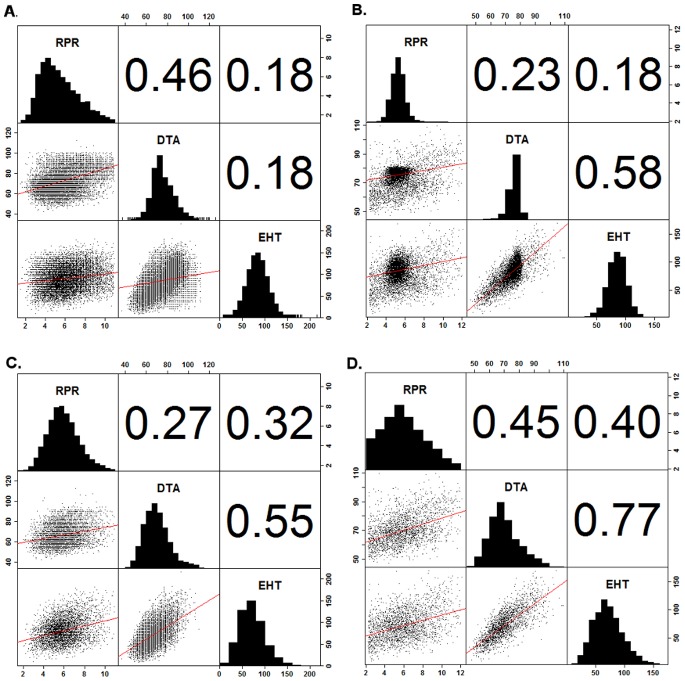
Figure 4. Trait correlations between RPR, DTA, and EHT variation.
Positive correlations between RPR and DTA were greater among plot means (A) than line means (B) across all RILs of the NAM families. However, the opposite relationship was observed between these traits among plot means (C) and line means (D) in the inbreds of the NCRPIS diversity panel. The relationship between RPR and EHT was less varied between the NAM and NCRPIS diversity panels.

