
Figure 5. Prediction of RPR in RIL families and NCRPIS diversity panel by GBLUP.
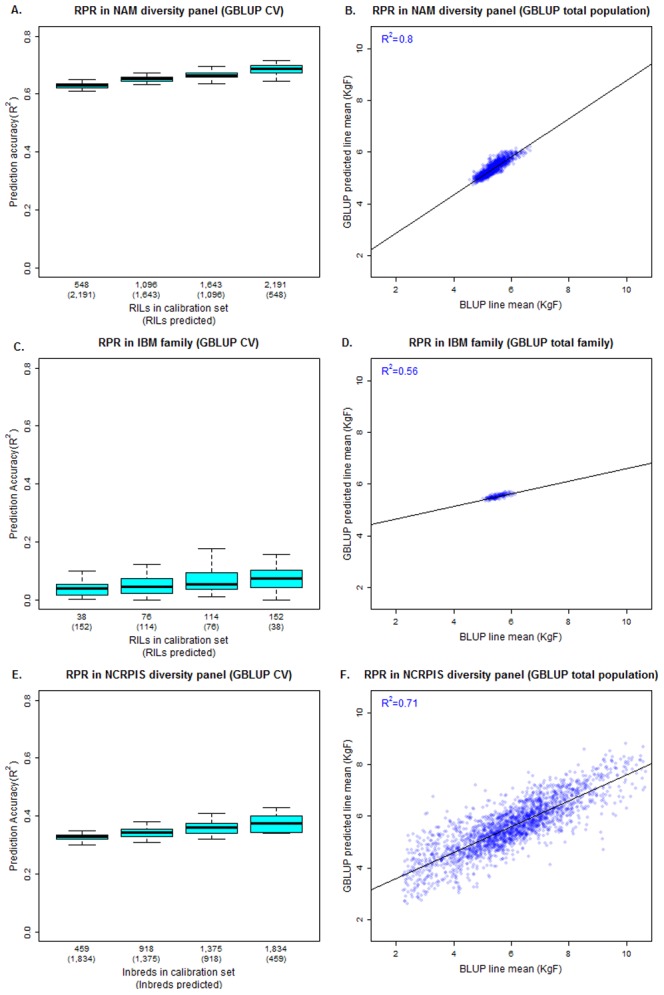
Cross-validation revealed steady gains in prediction accuracy with respect to the NAM family-stratified calibration set size (A). About 80% of the variation in BLUP line means for RPR was explained using an identity-by-state (IBS) genomic relationship matrix constructed from 1.6 million SNPs of the maize HapMapV1 (B). Using the same SNP set, prediction accuracy was not significant in the IBM family (C), and the variation explained by the entire family was only 56% (D). In the NCRPIS diversity panel, prediction accuracies were lower than in the NAM panel when using an IBS genomic relationship matrix of 681,257 SNPs constructed and fit in the same manner (E). In total, 71% of the variation in RPR was explained upon fitting the entire panel (F).