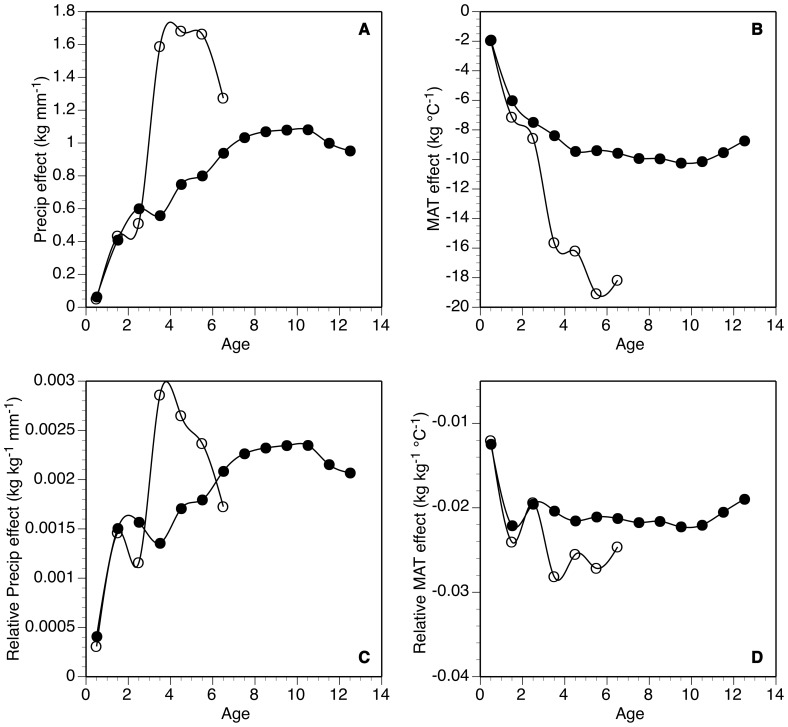
Figure 3. Patterns of bison mass with age.
Age-specific sensitivity of bison mass to variation in climate calculated on an absolute basis (a,b) and relative to the average mass of individuals at a given age (c,d) for June precipitation (a,c) and mean annual temperature (b,d). Smoothing splines used to connect individual points.

