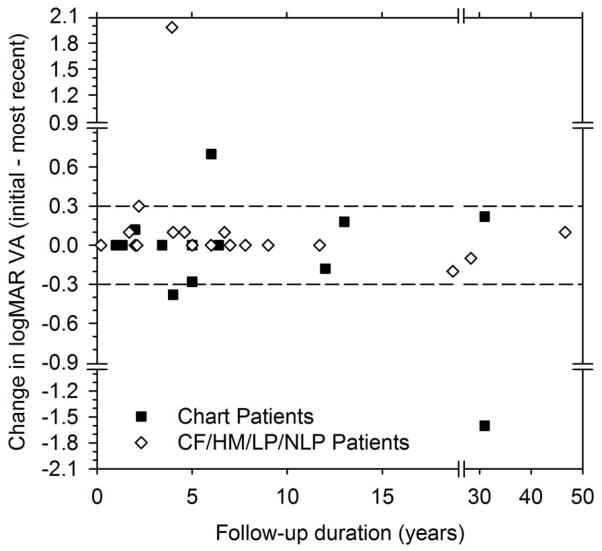
Figure 2.
Distribution of the change in VA from the initial to the most recent visit. Patients with measurable chart acuity are represented by the black bars and patients with non-measurable chart VA are represented by the gray bars. Negative values represent VA losses, whereas positive values represent gains in VA.

